

← Back to Disneyland Paris
Ride details

Disneyland Railroad Frontierland Depot

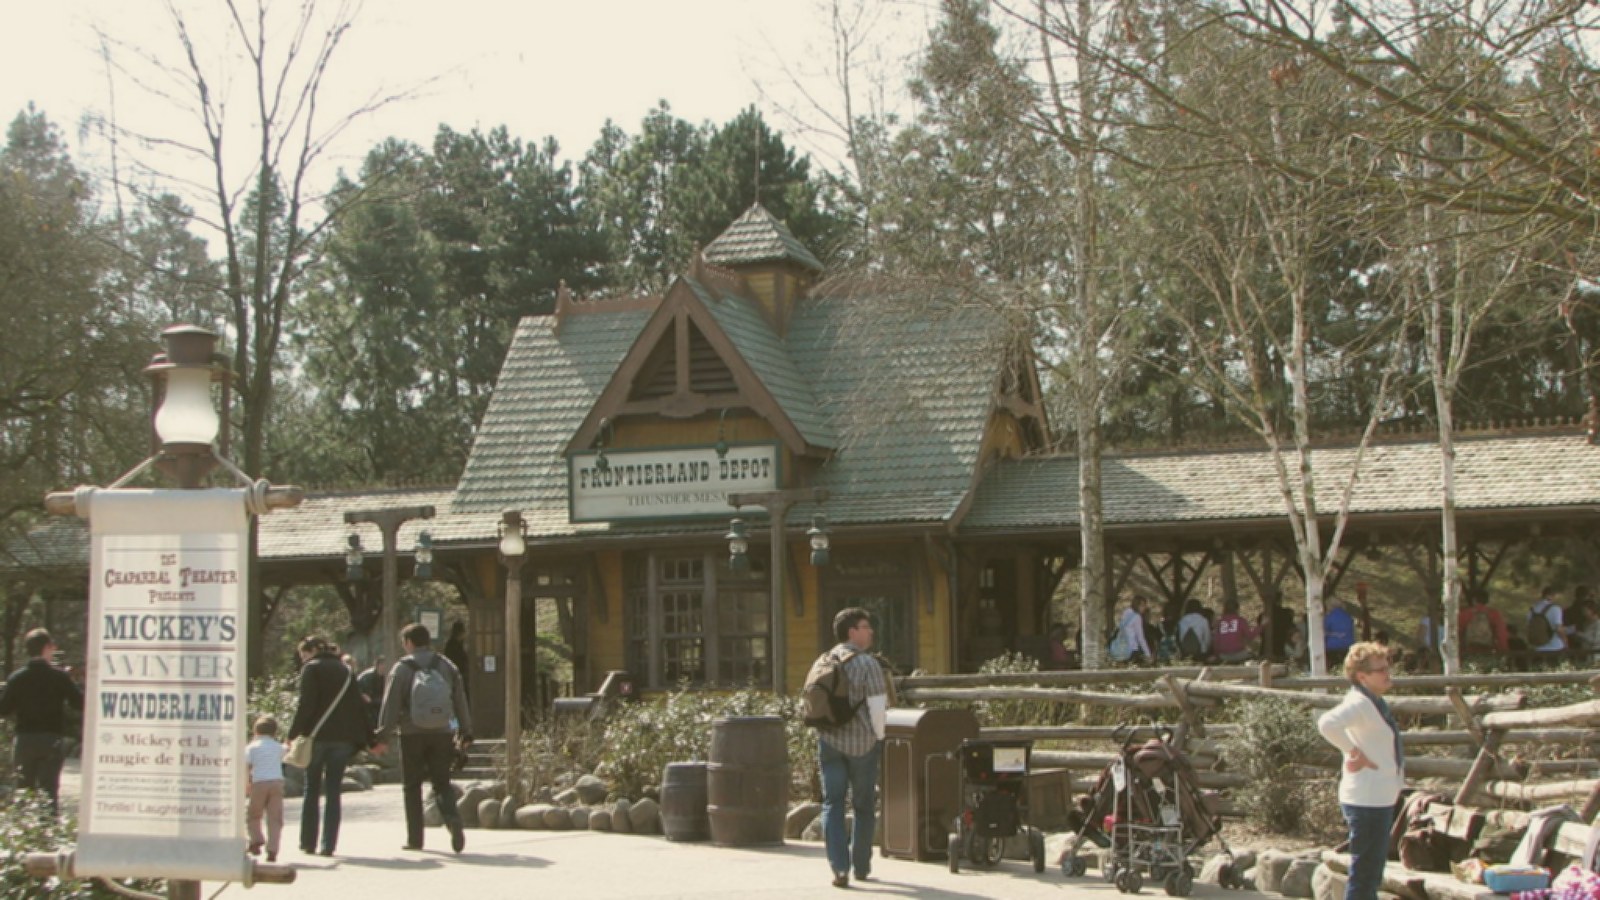
Frontierland-station van de Disneyland Railroad, met stoomtreinverbinding rond het park.

Disneyland Railroad Frontierland Depot is de stationservaring aan de westernzijde van Disneyland Park. Vanaf hier stap je op de smalspoor-stoomtrein voor de Grand Circle Tour langs landschappen, diorama's en andere themagebieden. Het station zelf versterkt de Thunder Mesa-sfeer: hout, spoorromantiek en het gevoel dat Frontierland onderdeel is van een groter netwerk.

Normal 20 min
Average 28 min
Highest measurement 60 min Measured at 24-07 13:17
Type Ride
Category Transport
Photos
RCDB

Coaster profile

Classification

Scale gentle
No RCDB coaster profile railroad station
Track gauge 3.0 ft (0.9 m)
Route length 7,150.0 ft (2,179.3 m)

Tracks

Length 7,152.2 ft (2,180.0 m)
Speed 10.0 mph (16.1 km/h)
Ride duration 25:00

Trains

Arrangement Onderdeel van de Disneyland Railroad met 4 stoomlocomotieven en 20 rijtuigen; tot circa 250 rijders per trein.
Trains 4
Cars per train 5
Riders per train 250

Location

Frontierland Depot bij Disneyland Park Paris, aan de route van de Disneyland Railroad.

Notes

Officiële Disneyland Paris-informatie beschrijft Frontierland Depot als opstapplaats voor de Disneyland Railroad. Wikipedia documenteert de volledige railroad als 7150 ft, 10 mph, 25-30 minuten, 4 locomotieven en 20 rijtuigen. Geen RCDB-profiel: dit is transport/erfgoedspoorweg.

Theming

Westernstation binnen Thunder Mesa met smalspoorstoomtrein en Frontierland-sfeer.

Data

Wait statistics

Based on available measurements and historical wait-time data.

Now Closed
Normal 20 min
Average 28 min
Highest measurement 60 min Measured at 24-07 13:17
Measurements 2378
Outage measurements 2161
Avg. outage duration 214 min
Often busy 13:00 40 min average
Often quiet 11:00 20 min average
Reliability High 2698 measurements, 9 hour blocks
Distribution

Boxplots

Spread of wait times, outage duration, and the number of outages per day based on available historical data.

Wait times

2378 measurements

0 min 15 min 30 min 45 min 60 min
Min
0 min
Q1
20 min
Median
20 min
Q3
40 min
Max
60 min

Typical wait time: around 20 min.

It usually falls between 20 min and 40 min.

See more than 40 min? It is probably busier than usual — consider a quieter moment.

Less than 20 min? You are in luck: that does not happen often.

Outage duration

43 outages

0 min 50 min 100 min 150 min 200 min
Min
1 min
Q1
3 min
Median
5 min
Q3
9 min
Max
165 min

On average, an outage lasts about 5 min.

In three out of four cases, the attraction reopens within 9 min.

If it takes longer, expect extra waiting time.

Outages per day

32 days

0 1 2 3 4
Min
1
Q1
2
Median
2
Q3
2
Max
4

On days with outages, we see an average of 2 per day.

That usually falls between 2 and 2.

On quiet days it was 1, on busy days up to 4.

Historical

Wait-time build-up

Today compared with historical wait times by hour.

Today Expected Historical
Horizontal axis hours, vertical axis queue minutes. 0 min 10 min 20 min 30 min 40 min 09:00 11:00 13:00 15:00 17:00 19:00 21:00 22:00