

← Back to Blackpool Pleasure Beach
Ride details

ICON

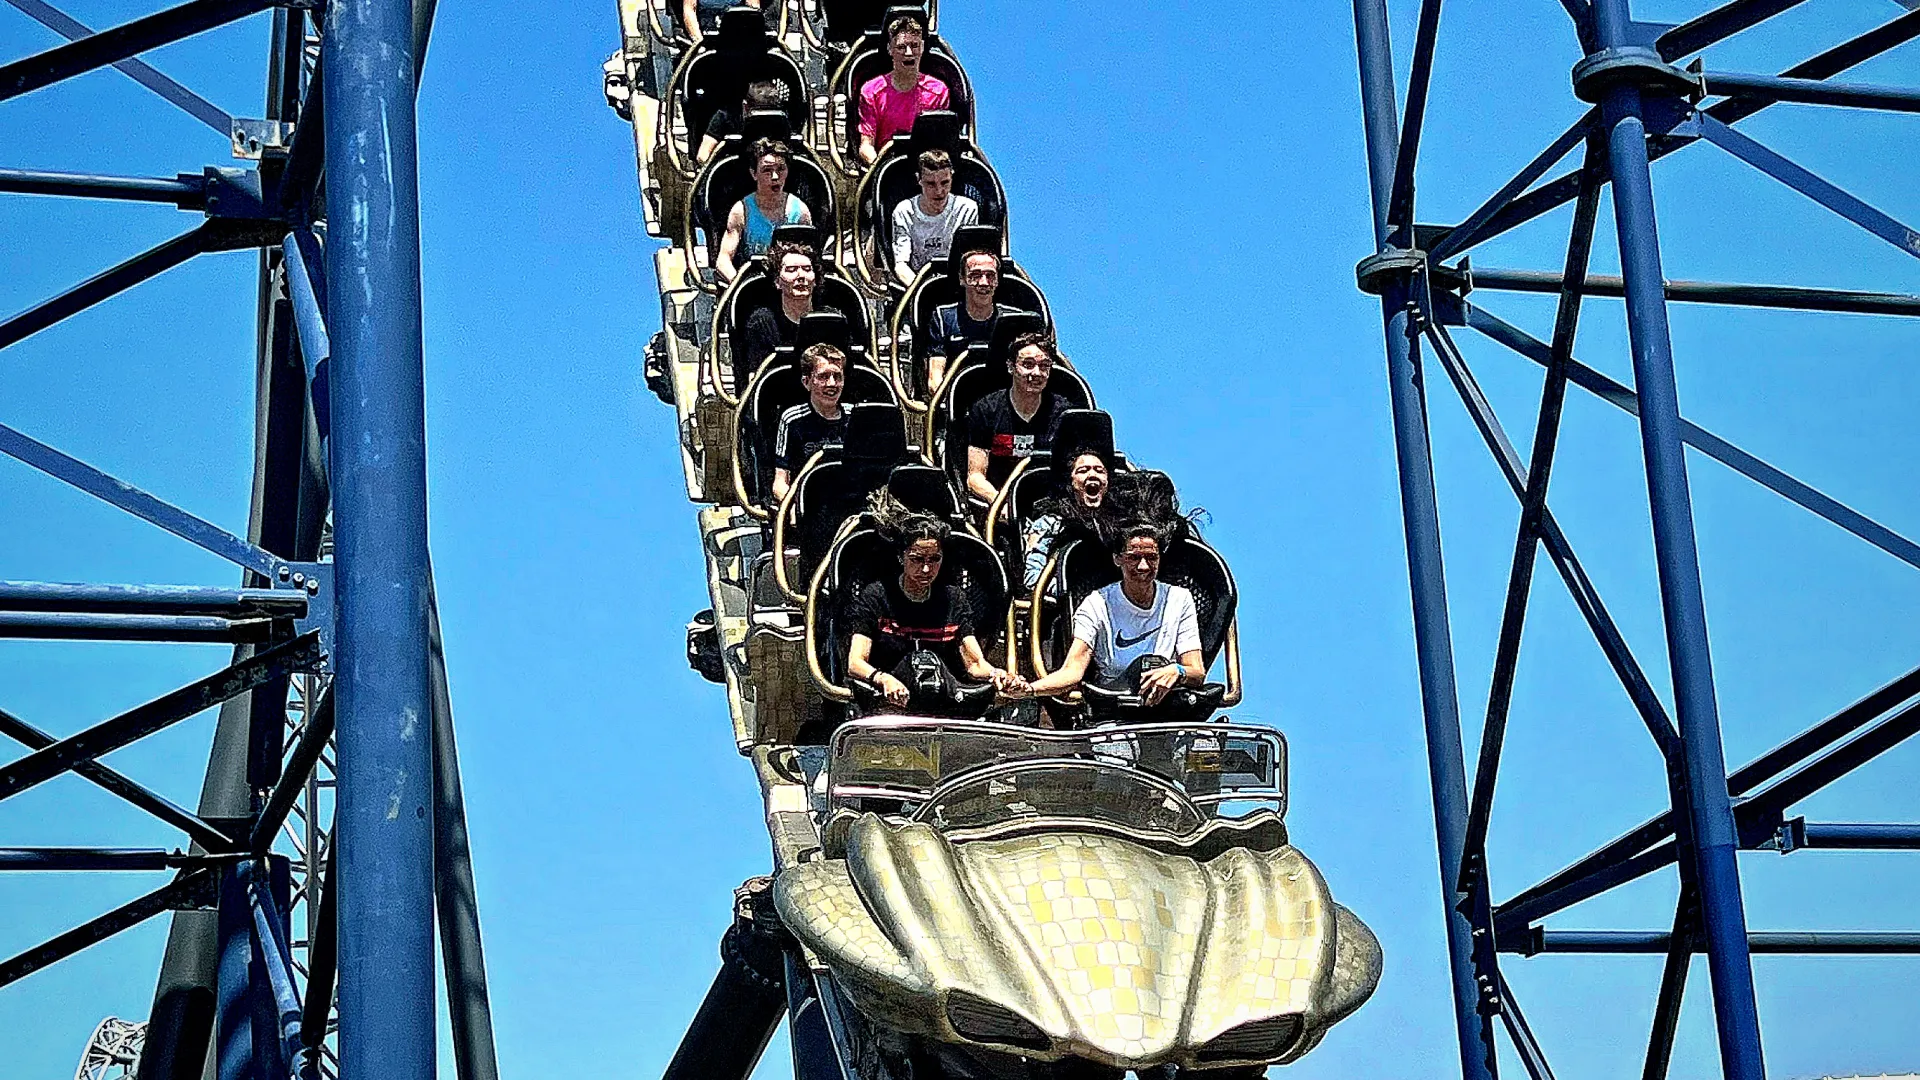
ICON is Pleasure Beach Resort's Mack launch coaster, with two LSM launches and a smooth inline twist.

ICON feels like the modern counterpart to Blackpool's classic coasters. The ride skims low through the park, crosses several existing routes and uses two launches to build speed all over again. Since the ENSO upgrade, one train also features a spinning rear car as a paid add-on experience.

Normal 40 min
Average 42 min
Highest measurement 240 min Measured at 16-07 14:59
Type Ride
Category Roller coaster
Photos
RCDB

Coaster profile

View on RCDB

Classification

RCDB #14312
RCDB status Operating since May 25, 2018
Classification Roller Coaster
Track type Steel
Design Spinning Cars
Scale Extreme
Categories Roller Coaster, Steel, Sit Down, Extreme, Spinning Cars
Bank angle 120 degrees
G-force 4.3G
Cost £16,250,000 (€19)
ENSO upcharge Standard £15, (€18)VIP £25 (€29)
ENSO back row minimum 150 cm

Tracks

Length 3,750.0 ft (1,143.0 m)
Height 88.5 ft (27.0 m)
Drop 82.0 ft (25.0 m)
Speed 52.8 mph (85.0 km/h)
Inversions 1
Ride duration 2:41

Trains

Arrangement 3 treinen met 4 wagens per trein; rijders zitten 2 naast elkaar in 2 rijen, samen 16 rijders per trein.
Trains 3
Cars per train 4
Rows per car 2
Riders per row 2
Riders per train 16

Location

Pleasure Beach Resort

Notes

RCDB lists a 3,750-foot track length, an 88.5-foot height, an 82-foot drop, a top speed of 52.8 mph, 1 inversion, a 2:41 ride time, 4.3 G and three trains seating 16 riders each. The official park page confirms an opening date of 25 May 2018 and describes ICON as the United Kingdom's first double-launch coaster.

Theming

Clean-lined steel launch coaster with minimalist ICON branding and several interactions with existing rides across the park.

Data

Wait statistics

Based on available measurements and historical wait-time data.

Now Closed
Normal 40 min
Average 42 min
Highest measurement 240 min Measured at 16-07 14:59
Measurements 1235
Outage measurements 31
Avg. outage duration 14 min
Often busy 12:00 40 min average
Often quiet 19:00 23 min average
Reliability High 1314 measurements, 12 hour blocks
Distribution

Boxplots

Spread of wait times, outage duration, and the number of outages per day based on available historical data.

Wait times

1235 measurements

0 min 100 min 200 min 300 min
Min
0 min
Q1
25 min
Median
30 min
Q3
50 min
Max
240 min

Typical wait time: around 30 min.

It usually falls between 25 min and 50 min.

See more than 50 min? It is probably busier than usual — consider a quieter moment.

Less than 25 min? You are in luck: that does not happen often.

Outage duration

14 outages

0 min 20 min 40 min 60 min 80 min
Min
5 min
Q1
5 min
Median
5 min
Q3
11 min
Max
63 min

On average, an outage lasts about 5 min.

In three out of four cases, the attraction reopens within 11 min.

If it takes longer, expect extra waiting time.

Outages per day

7 days

0 1 2 3 4
Min
1
Q1
2
Median
2
Q3
2
Max
4

On days with outages, we see an average of 2 per day.

That usually falls between 2 and 2.

On quiet days it was 1, on busy days up to 4.

Historical

Wait-time build-up

Today compared with historical wait times by hour.

Today Expected Historical
Horizontal axis hours, vertical axis queue minutes. 0 min 10 min 20 min 30 min 40 min 10:00 12:00 14:00 16:00 18:00 20:00 21:00