

← Back to Bobbejaanland
Ride details

Typhoon

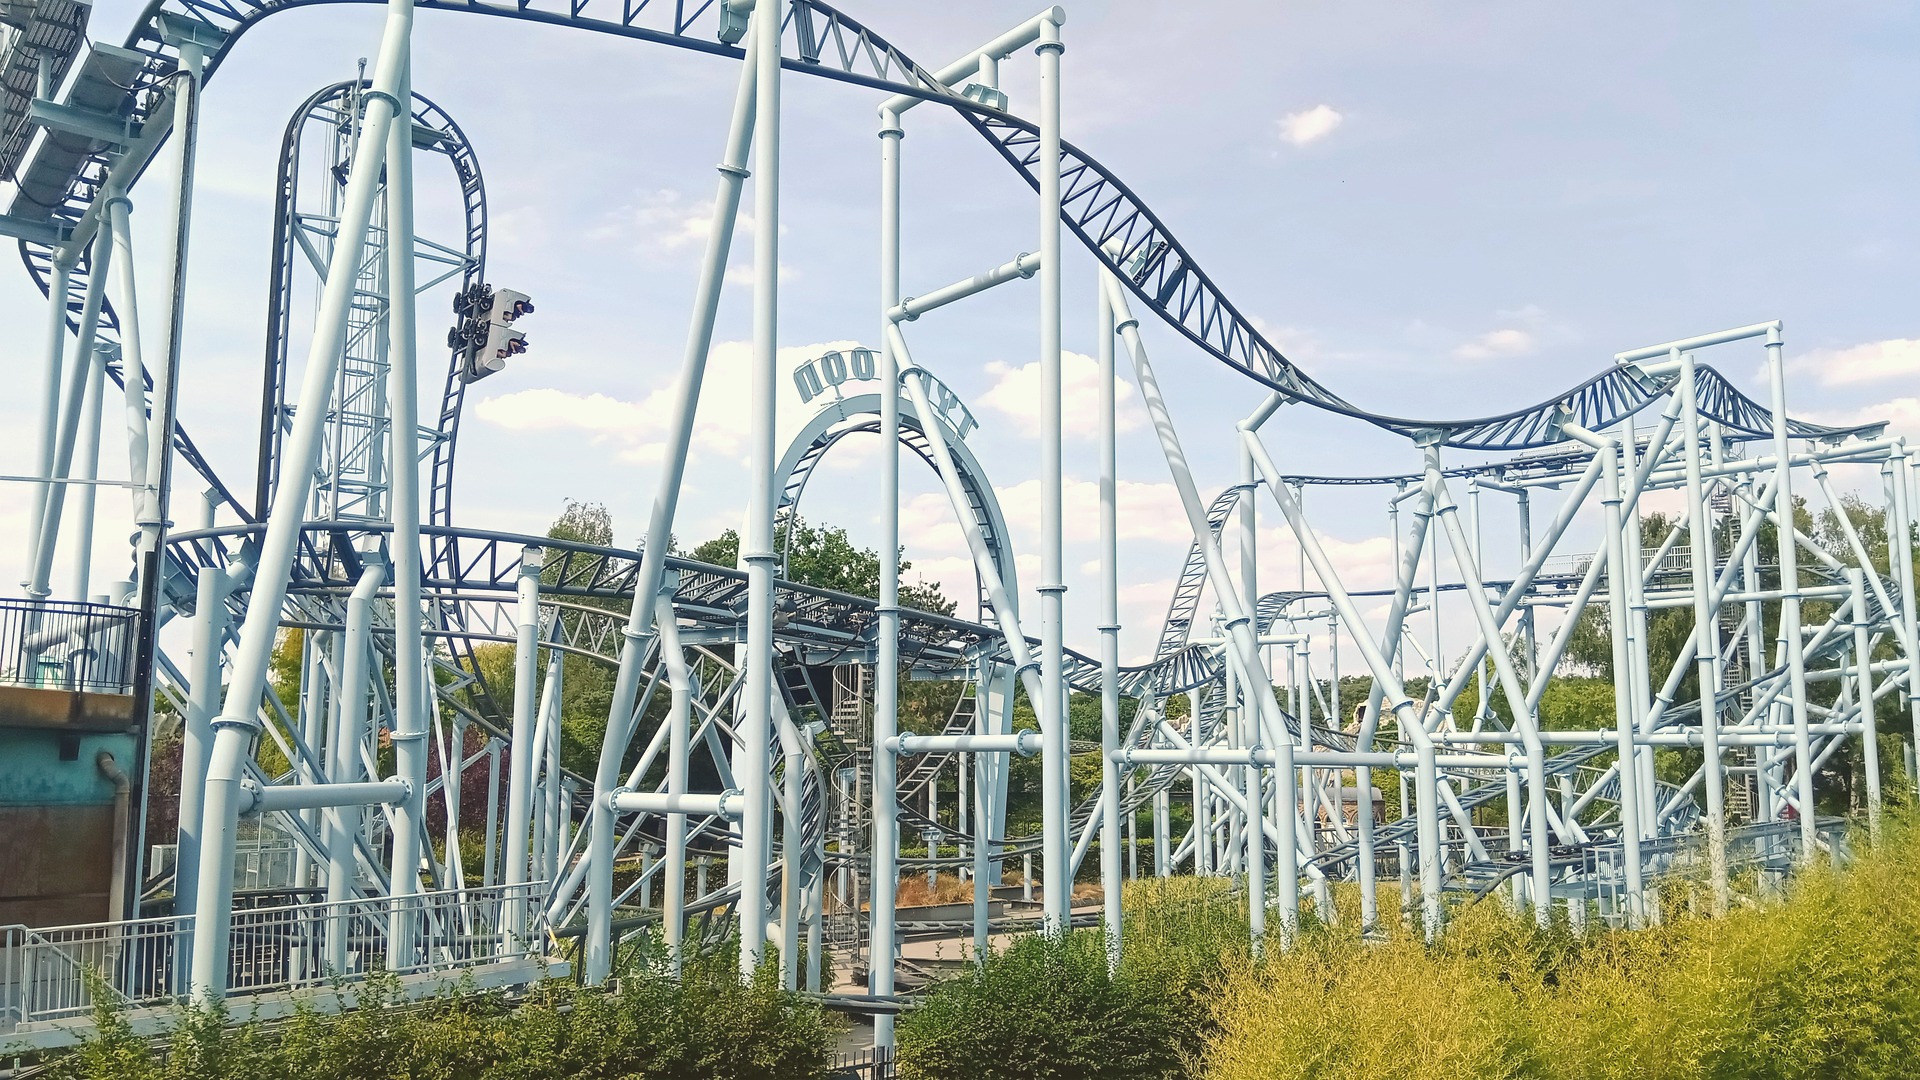
Gerstlauer Euro-Fighter in Land of Legends with a vertical lift, a 97-degree first drop and four inversions.

Typhoon is Bobbejaanland's compact but fierce whirlwind: after the vertical lift, the track dives steeper than straight down and packs a loop, rolls and helices into a short, punchy layout. Since the Land of Legends retheme, Typhoon has represented the element of wind.

Normal 30 min
Average 17 min
Highest measurement 65 min Measured at 29-06 11:17
Type Ride
Category Roller coaster
Photos
RCDB

Coaster profile

View on RCDB

Classification

RCDB #2229
RCDB status Operating since April 10, 2004
Classification Roller Coaster
Track type Steel
Design Sit Down
Scale Extreme
Categories Roller Coaster, Steel, Sit Down, Extreme
Opening 10-04-2004
Verticale hoek 97°
G-kracht 5
Afmetingen 187.0 ft (57.0 m) x 95.1 ft (29.0 m)
Kosten 5.000.000
Thema Leisure Expert Group B.V.; Themebuilders Philippines Inc.
Installateur RCS GmbH

Tracks

Length 2,198.2 ft (670.0 m)
Height 84.3 ft (25.7 m)
Drop 82.0 ft (25.0 m)
Speed 49.7 mph (80.0 km/h)
Inversions 4
Ride duration 1:30

Trains

Arrangement 8 losse Euro-Fighterwagens; rijders zitten 4 naast elkaar in 2 rijen, samen 8 rijders per wagen.
Trains 8
Cars per train 1
Rows per car 2
Riders per row 4
Riders per train 8
Capacity per hour 1,400

Location

Typhoon sits in Land of Legends, where it anchors Bobbejaanland's more intense cluster of thrill rides.

Notes

The coaster became part of Land of Legends in 2019. RCDB lists an investment of 5,000,000, a capacity of 1,400 riders per hour and RCS GmbH as the installer.

Theming

Within Land of Legends, Typhoon channels the force of wind: Wayra and the Skyriders frame the story around its 82-foot plunge.

Data

Wait statistics

Based on available measurements and historical wait-time data.

Now 30 min
Normal 30 min
Average 17 min
Highest measurement 65 min Measured at 29-06 11:17
Measurements 1481
Outage measurements 136
Avg. outage duration 170 min
Often busy 11:00 30 min average
Often quiet 19:00 5 min average
Reliability High 1585 measurements, 11 hour blocks
Distribution

Boxplots

Spread of wait times, outage duration, and the number of outages per day based on available historical data.

Wait times

1481 measurements

0 min 20 min 40 min 60 min 80 min
Min
5 min
Q1
6 min
Median
15 min
Q3
25 min
Max
65 min

Typical wait time: around 15 min.

It usually falls between 6 min and 25 min.

See more than 25 min? It is probably busier than usual — consider a quieter moment.

Less than 6 min? You are in luck: that does not happen often.

Outage duration

46 outages

0 min 25 min 50 min 75 min 100 min
Min
2 min
Q1
5 min
Median
8 min
Q3
15 min
Max
91 min

On average, an outage lasts about 8 min.

In three out of four cases, the attraction reopens within 15 min.

If it takes longer, expect extra waiting time.

Outages per day

25 days

0 1 2 3 4
Min
1
Q1
2
Median
2
Q3
2
Max
4

On days with outages, we see an average of 2 per day.

That usually falls between 2 and 2.

On quiet days it was 1, on busy days up to 4.

Historical

Wait-time build-up

Today compared with historical wait times by hour.

Today Expected Historical
Horizontal axis hours, vertical axis queue minutes. 0 min 10 min 20 min 30 min 10:00 12:00 14:00 16:00 18:00 20:00 21:00