

← Back to Alton Towers
Ride details

Oblivion

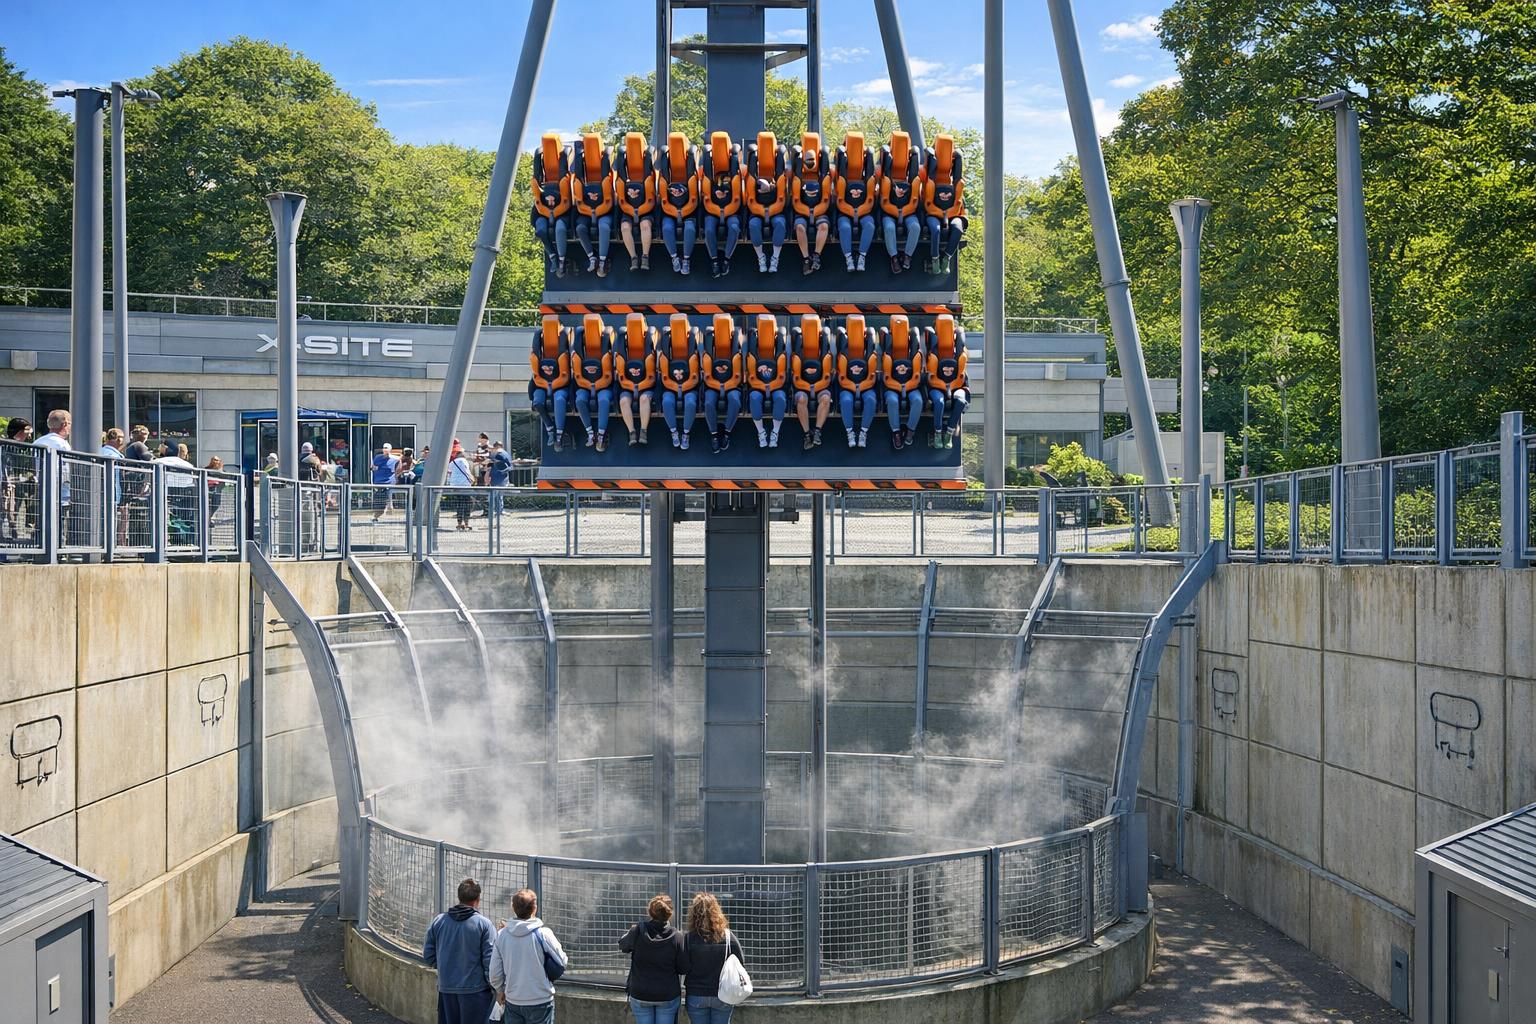
Oblivion is the world's first B&M Dive Coaster, with a 180 ft drop, an 87.5-degree plunge and a 68 mph top speed.

Oblivion is built around a single moment: the brief pause above the tunnel and the plunge into darkness. That simplicity is exactly what makes the ride hit so hard. X-Sector feels like a test facility where the whole queue builds towards one command: don't look down.

Normal 30 min
Average 32 min
Highest measurement 135 min Measured at 14-07 12:01
Type Ride
Category Roller coaster
Photos
RCDB

Coaster profile

View on RCDB

Classification

RCDB #777
RCDB status operating since March 14, 1998
Classification Roller Coaster
Track type steel
Design Sit Down
Scale Extreme
Layout Dive Coaster
Categories Roller Coaster, Steel, Sit Down, Extreme
Vertical angle 87.5 degrees
G-force 4.5G
Cost 12000000 GBP

Tracks

Length 1,222.0 ft (372.5 m)
Height 65.0 ft (19.8 m)
Drop 180.0 ft (54.9 m)
Speed 68.0 mph (109.4 km/h)
Inversions 0
Ride duration 1:15

Trains

Arrangement 7 afzonderlijke dive-coasterwagens; rijders zitten 8 naast elkaar in 2 rijen, samen 16 rijders per wagen.
Trains 7
Cars per train 1
Rows per car 2
Riders per row 8
Riders per train 16
Capacity per hour 1,820

Location

Oblivion sits in X-Sector; the short layout is built around the tension in the queue, the holding brake and the dive into an underground tunnel.

Notes

RCDB lists 1,222 ft of track, a 65 ft height, a 180 ft drop, 68 mph, an 87.5-degree plunge, a 1:15 ride time, 4.5 g and 1,820 riders per hour. Alton Towers markets it as the world's first vertical drop roller coaster.

Theming

This X-Sector thrill ride leans into test-facility styling and psychological tension, all centred on the famous tunnel drop.

Record context

Oblivion opened in 1998 as the world's first B&M Dive Coaster, and Alton Towers built the attraction around the message \"Don't look down\".

Data

Wait statistics

Based on available measurements and historical wait-time data.

Now Closed
Normal 30 min
Average 32 min
Highest measurement 135 min Measured at 14-07 12:01
Measurements 1262
Outage measurements 0
Avg. outage duration -
Often busy 12:00 40 min average
Often quiet 17:00 10 min average
Reliability High 1376 measurements, 8 hour blocks
Distribution

Boxplots

Spread of wait times, outage duration, and the number of outages per day based on available historical data.

Wait times

1262 measurements

0 min 40 min 80 min 120 min 160 min
Min
5 min
Q1
15 min
Median
30 min
Q3
45 min
Max
135 min

Typical wait time: around 30 min.

It usually falls between 15 min and 45 min.

See more than 45 min? It is probably busier than usual — consider a quieter moment.

Less than 15 min? You are in luck: that does not happen often.

Outage duration

Not enough data yet for a boxplot.

This attraction has not reported any outages to us yet. We cannot say anything meaningful about it here.

Outages per day

Not enough data yet for a boxplot.

This attraction has not reported any outages to us yet. We cannot say anything meaningful about it here.

Historical

Wait-time build-up

Today compared with historical wait times by hour.

Today Expected Historical
Horizontal axis hours, vertical axis queue minutes. 0 min 10 min 20 min 30 min 40 min 10:00 11:00 12:00 13:00 14:00 15:00 16:00 17:00 18:00