

← Back to Magic Kingdom Park
Ride details

Dumbo the Flying Elephant

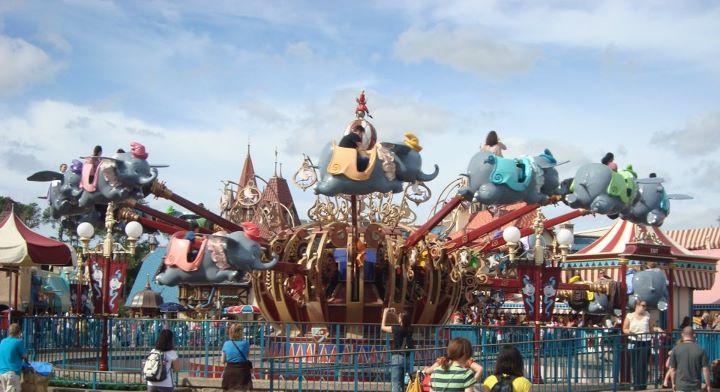
Dumbo the Flying Elephant is geen achtbaan maar een klassieke vliegende draaimolen in Storybook Circus, waarbij bezoekers zelf de hoogte van hun olifant bepalen.

Dumbo the Flying Elephant is een zachte familieattractie rond de Disney-film uit 1941. Bezoekers stappen in een Dumbo-voertuig, draaien rond boven water en fonteinen en kunnen hun gondel hoger of lager laten vliegen. De Magic Kingdom-versie opende met het park en werd in 2012 naar Storybook Circus verplaatst en uitgebreid met een tweede molen.

Normal 5 min
Average 10 min
Highest measurement 45 min Measured at 30-07 20:43
Type Ride
Category Aerial Ride
Photos
RCDB

Coaster profile

Classification

Scale low

Notes

De attractie opende op 1 oktober 1971 met Magic Kingdom. In 2012 verhuisde Dumbo naar Storybook Circus en werd de capaciteit vergroot door een tweede carrousel toe te voegen.

Theming

De rit gebruikt de circussfeer uit Dumbo, met Timothy Q. Mouse, vliegende olifanten en een wachtrij met een indoor speeltent voor kinderen.

Data

Wait statistics

Based on available measurements and historical wait-time data.

Now Closed
Normal 5 min
Average 10 min
Highest measurement 45 min Measured at 30-07 20:43
Measurements 7154
Outage measurements 513
Avg. outage duration 31 min
Often busy 20:00 25 min average
Often quiet 08:00 5 min average
Reliability High 7093 measurements, 16 hour blocks
Distribution

Boxplots

Spread of wait times, outage duration, and the number of outages per day based on available historical data.

Wait times

7154 measurements

0 min 15 min 30 min 45 min
Min
5 min
Q1
5 min
Median
5 min
Q3
15 min
Max
45 min

Typical wait time: around 5 min.

It usually falls between 5 min and 15 min.

See more than 15 min? It is probably busier than usual — consider a quieter moment.

Less than 5 min? You are in luck: that does not happen often.

Outage duration

92 outages

0 min 50 min 100 min 150 min 200 min
Min
3 min
Q1
5 min
Median
8 min
Q3
36 min
Max
180 min

Outages usually last about 8 min.

Some are over quickly (sometimes within 5 min), others take longer (up to 36 min). That varies per outage.

Already longer than 36 min? The attraction may stay closed a while longer.

Outages per day

28 days

0 4 8 12 16
Min
2
Q1
2
Median
2
Q3
4
Max
13

On days with outages, we see an average of 2 per day.

That usually falls between 2 and 4.

On quiet days it was 2, on busy days up to 13.

Historical

Wait-time build-up

Today compared with historical wait times by hour.

Today Historical Outage
Horizontal axis hours, vertical axis queue minutes. 0 min 10 min 20 min 30 min 40 min 09:00 11:00 13:00 15:00 17:00 19:00 21:00 23:00