

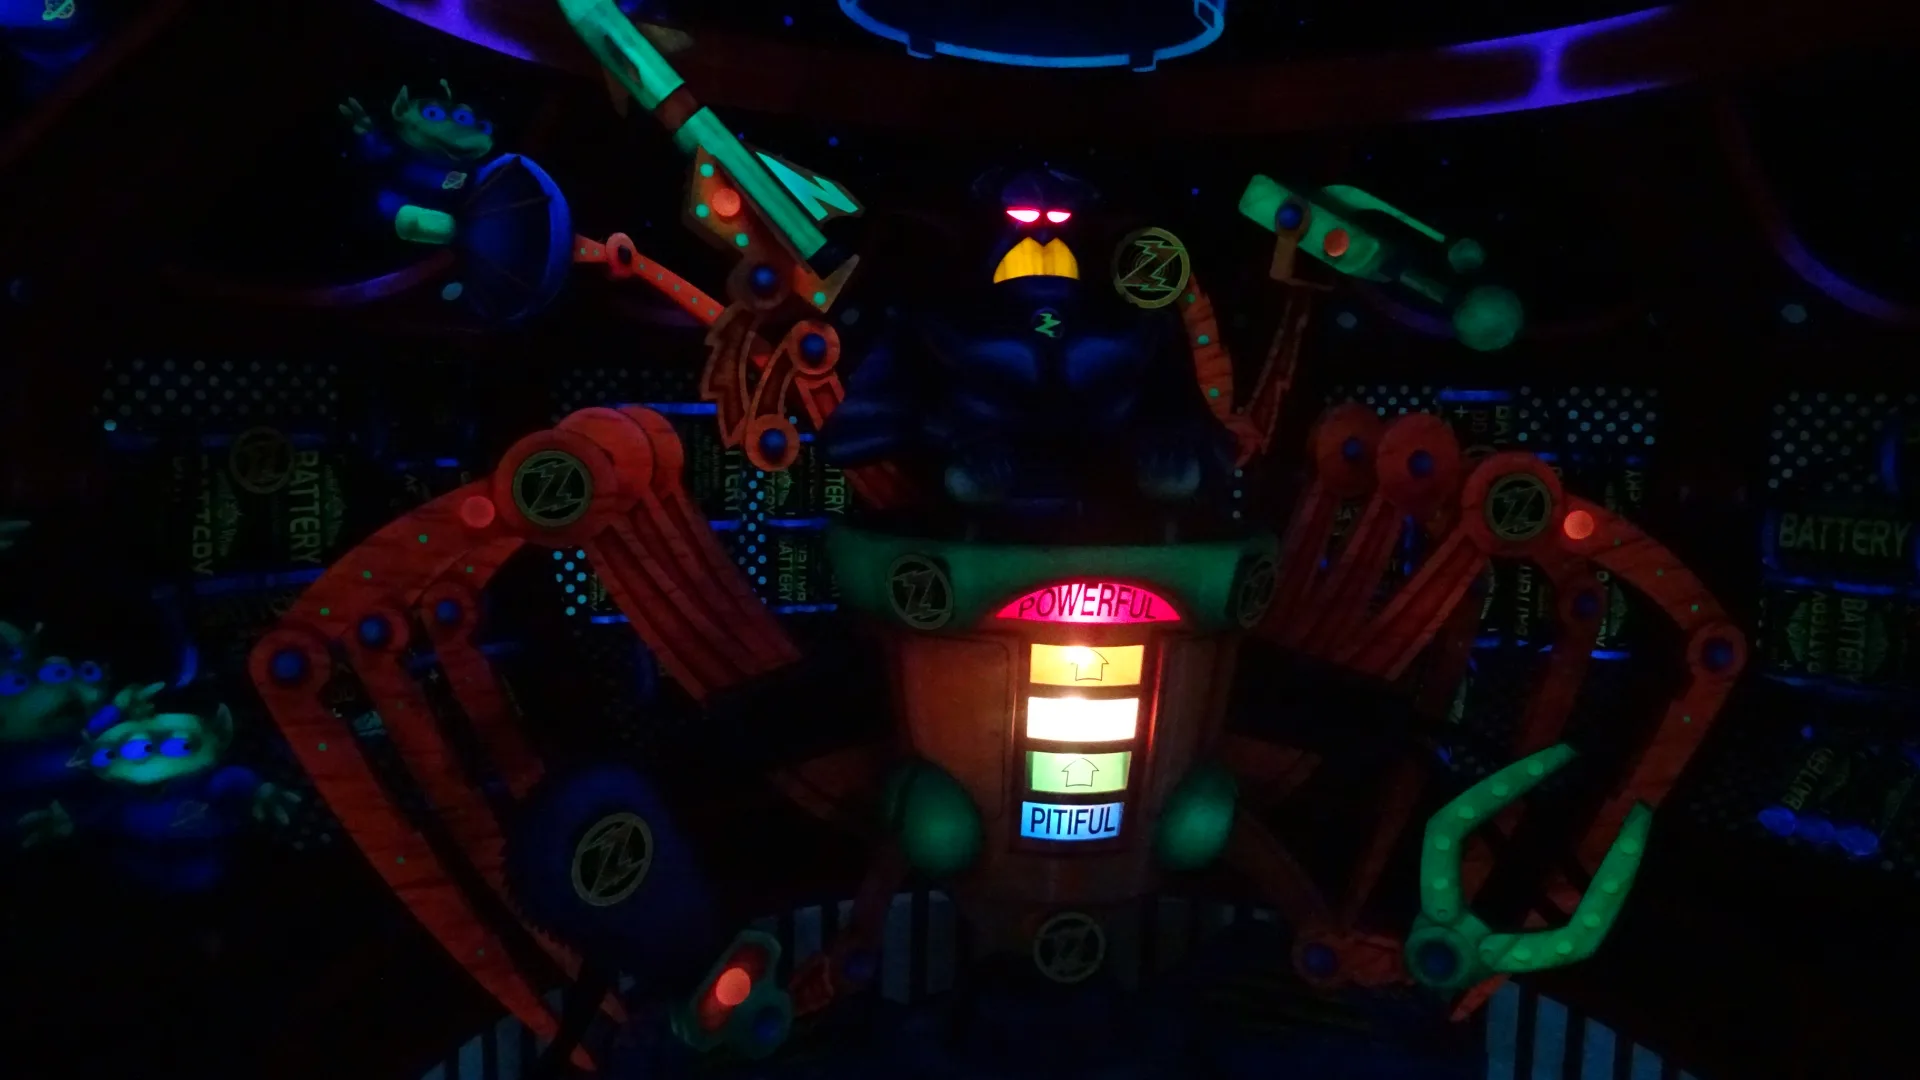
Photo 1 of Buzz Lightyear’s Space Ranger Spin
← Back to Magic Kingdom Park
Ride details

Buzz Lightyear’s Space Ranger Spin

Buzz Lightyear’s Space Ranger Spin is een interactieve darkride waarin gasten met blasters punten scoren tegen Zurg.

In Buzz Lightyear’s Space Ranger Spin stappen gasten in een draaiend ruimtevoertuig en worden ze Star Command-rekruten. De route combineert een rustige Omnimover-darkride met een schietspel: mikken, draaien en doelen raken bepalen de score. Sinds de recente vernieuwing draait de attractie nog sterker om actieve gameplay met beter bestuurbare blasters en duidelijkere feedback.

Normal 40 min
Average 33 min
Highest measurement 80 min Measured at 19-08 15:22
Type Ride
Category Dark Ride
Photos
RCDB

Coaster profile

Classification

Scale family
Official height rule Any Height
Official location Tomorrowland at Magic Kingdom Park
Wikipedia technical profile Shooting dark ride; Omnimover; Walt Disney Imagineering; Arrow Development / Sansei Yusoki; opened 1998-11-03
Disney Parks Blog update Starting 2026-04-08, upgraded vehicles, handheld blasters and Buddy support bot
Ride format Interactive indoor slow ride with spinning vehicles

Notes

De Magic Kingdom-versie opende oorspronkelijk op 3 november 1998 en heropende op 8 april 2026 na een technische update met handheld blasters, nieuwe doelen en Buddy als support-bot.

Theming

Het verhaal draait om Buzz Lightyear, Star Command en de strijd tegen Emperor Zurg binnen Tomorrowland.

Data

Wait statistics

Based on available measurements and historical wait-time data.

Now Closed
Normal 40 min
Average 33 min
Highest measurement 80 min Measured at 19-08 15:22
Measurements 14685
Outage measurements 534
Avg. outage duration 27 min
Often busy 18:00 40 min average
Often quiet 08:00 5 min average
Reliability High 14403 measurements, 16 hour blocks
Distribution

Boxplots

Spread of wait times, outage duration, and the number of outages per day based on available historical data.

Wait times

14685 measurements

0 min 20 min 40 min 60 min 80 min
Min
5 min
Q1
25 min
Median
35 min
Q3
40 min
Max
80 min

Typical wait time: around 35 min.

It usually falls between 25 min and 40 min.

See more than 40 min? It is probably busier than usual — consider a quieter moment.

Less than 25 min? You are in luck: that does not happen often.

Outage duration

103 outages

0 min 25 min 50 min 75 min 100 min
Min
1 min
Q1
5 min
Median
5 min
Q3
16 min
Max
93 min

Outages usually last about 5 min.

Some are over quickly (sometimes within 5 min), others take longer (up to 16 min). That varies per outage.

Already longer than 16 min? The attraction may stay closed a while longer.

Outages per day

52 days

0 2 4 6 8
Min
1
Q1
1
Median
2
Q3
2
Max
7

On days with outages, we see an average of 2 per day.

That usually falls between 1 and 2.

On quiet days it was 1, on busy days up to 7.

Historical

Wait-time build-up

Today compared with historical wait times by hour.

Today Expected Historical
Horizontal axis hours, vertical axis queue minutes. 0 min 10 min 20 min 30 min 40 min 09:00 11:00 13:00 15:00 17:00 19:00 21:00 23:00