

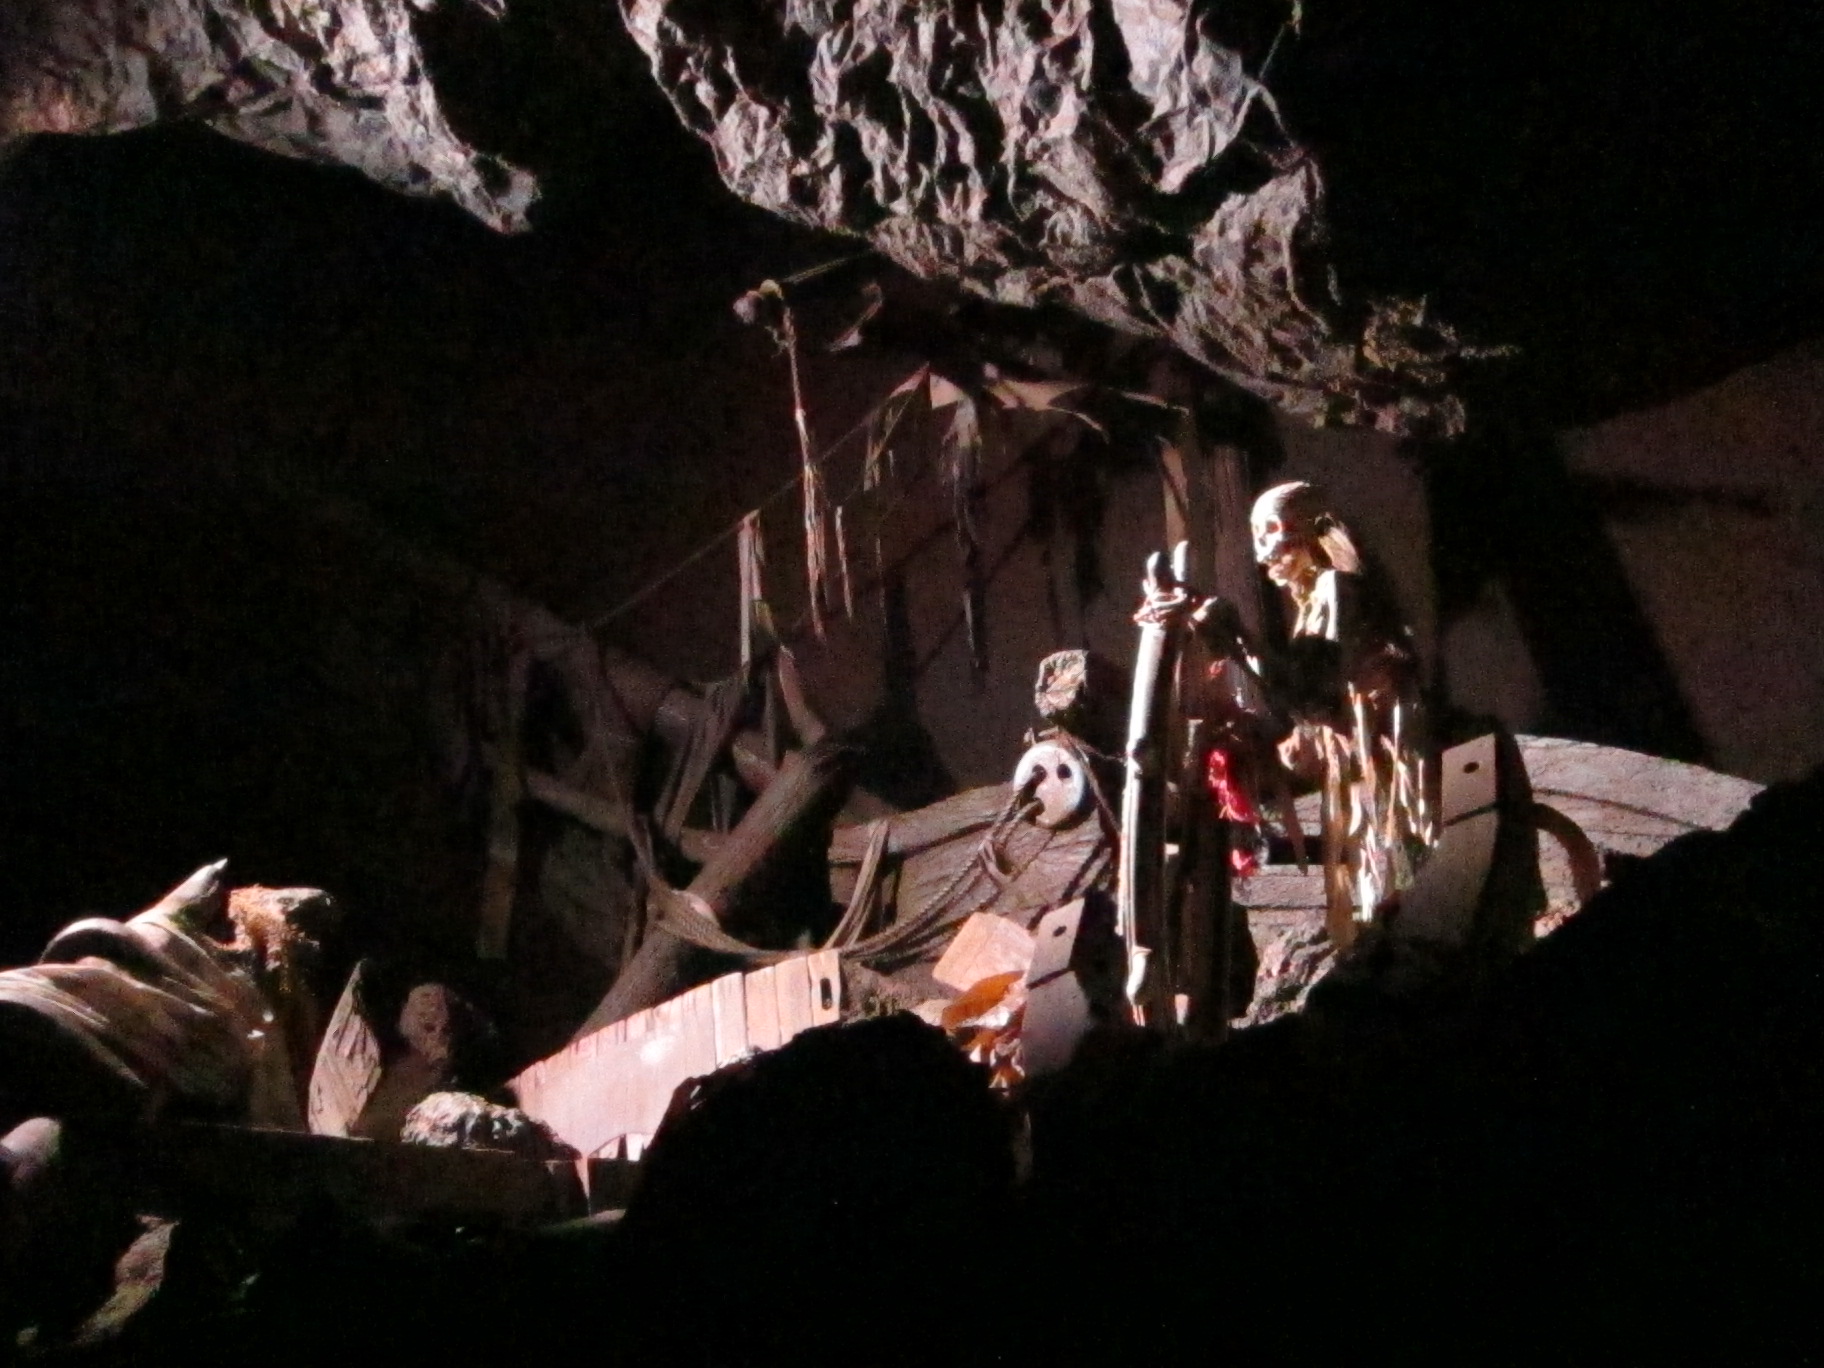
Photo 1 of Pirates of the Caribbean
← Back to Disneyland Park
Ride details

Pirates of the Caribbean

Een New Orleans Square-bootdarkride zonder minimumlengte, met twee drops, 119 Audio-Animatronics en piratenchaos.

Pirates of the Caribbean begint bijna stil in een Louisiana-bayou en zakt daarna af naar een wereld van skeletten, schatten, kanonvuur en brandende havenstraten. De boten bewegen rustig, maar de attractie is groots in schaal: lange scènes, muziek, geur, schaduw en Audio-Animatronics bouwen samen een compleet piratenuniversum. Het was de laatste Disneyland-attractie waar Walt Disney zelf nog inhoudelijk aan meewerkte.

Normal 5 min
Average 16 min
Highest measurement 50 min Measured at 20-07 19:47
Type Ride
Category Dark Ride
Photos
RCDB

Coaster profile

Classification

Scale family
Opened March 18, 1967
Ride type Boat dark ride
Manufacturer Arrow Development
Designer WED Enterprises / Walt Disney Imagineering
Vehicle type Bateaux / boats
Vehicles 50 boats
Riders per vehicle 23-24
Duration 15 minutes 30 seconds
Drops 2
Audio-Animatronics 119
Minimum height None
Current official note Closed for refurbishment

Tracks

Ride duration 15:30

Trains

Arrangement Boat dark ride met bateaux; Wikipedia vermeldt voor Disneyland 50 boten en een capaciteit van 23 tot 24 rijders per boot, daarom is alleen het exacte vlootaantal als hard veld gezet.
Trains 50

Notes

De officiele Disneyland Resort-pagina vermeldt New Orleans Square, Any Height, huidige refurbishment, opening op 18 maart 1967 en de evolutie van gepland waxmuseum naar Audio-Animatronics-bootrit. D23 bevestigt opening op 18 maart 1967. Wikipedia vult Arrow Development, WED Enterprises, bateaux, 50 boten, 23-24 rijders per boot, 15:30 ritduur, 2 drops en 119 Audio-Animatronics aan.

Theming

New Orleans Square-bootdarkride rond de Golden Age of Piracy, met bayou-instap, Pirates Grotto, Dead men tell no tales, fort-vs-galleon-kanonvuur, brandende stad, jail dog, Yo Ho-lied en Captain Jack Sparrow-toevoegingen.

Data

Wait statistics

Based on available measurements and historical wait-time data.

Now Closed
Normal 5 min
Average 16 min
Highest measurement 50 min Measured at 20-07 19:47
Measurements 14741
Outage measurements 2622
Avg. outage duration 73 min
Often busy 11:00 20 min average
Often quiet 08:00 5 min average
Reliability High 15257 measurements, 16 hour blocks
Distribution

Boxplots

Spread of wait times, outage duration, and the number of outages per day based on available historical data.

Wait times

14741 measurements

0 min 15 min 30 min 45 min 60 min
Min
5 min
Q1
10 min
Median
15 min
Q3
20 min
Max
50 min

Typical wait time: around 15 min.

It usually falls between 10 min and 20 min.

See more than 20 min? It is probably busier than usual — consider a quieter moment.

Less than 10 min? You are in luck: that does not happen often.

Outage duration

189 outages

0 min 30 min 60 min 90 min 120 min
Min
2 min
Q1
5 min
Median
5 min
Q3
15 min
Max
119 min

Outages usually last about 5 min.

Some are over quickly (sometimes within 5 min), others take longer (up to 15 min). That varies per outage.

Already longer than 15 min? The attraction may stay closed a while longer.

Outages per day

69 days

0 3 6 9 12
Min
1
Q1
2
Median
2
Q3
3
Max
10

On days with outages, we see an average of 2 per day.

That usually falls between 2 and 3.

On quiet days it was 1, on busy days up to 10.

Historical

Wait-time build-up

Today compared with historical wait times by hour.

Today Expected Historical
Horizontal axis hours, vertical axis queue minutes. 0 min 5 min 10 min 15 min 20 min 08:00 10:00 12:00 14:00 16:00 18:00 20:00 22:00 23:00