

← Back to Disneyland Park
Ride details

Mad Tea Party

Een opening-day Fantasyland-teacupsrit zonder minimumlengte, waarin gasten hun eigen kopje sneller of rustiger laten draaien.

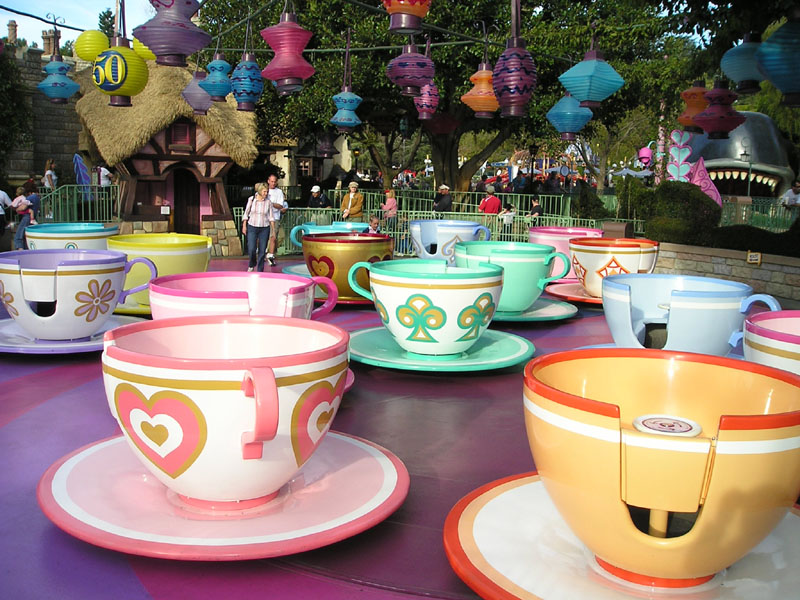
Mad Tea Party is de vrolijk chaotische Alice-rit waar de gast zelf de toon zet. De theekopjes draaien op kleinere platforms binnen een groter draaiend geheel, waardoor elke rit net anders voelt. Wie rustig blijft zitten krijgt een kleurrijke Fantasyland-wals; wie aan het middenwiel draait, maakt er een echte unbirthday-wervel van.

Normal 5 min
Average 6 min
Highest measurement 25 min Measured at 17-06 18:23
Type Ride
Category Teacups
Photos
RCDB

Coaster profile

Classification

Scale family
Opened July 17, 1955
Ride type Spinning teacups
Manufacturer Arrow Development
Designer Walt Disney Imagineering
Minimum height None
Ride system Three small turntables on one large turntable
Major remodel 1983 relocation and Fantasyland update
Rider control Center wheel controls spin

Trains

Arrangement 18 theekopjes op drie kleine draaischijven binnen een groter draaiend platform; Disneyland Resort noemt maximaal 5 gasten per kopje en gasten bepalen zelf hoeveel zij spinnen.
Trains 18
Riders per train 5

Notes

De officiele Disneyland Resort-pagina vermeldt Fantasyland, Any Height, oversized teacups en de Mad Hatter's tea party als inspiratie. D23 noemt Mad Tea Party als opening-day attractie van Disneyland op 17 juli 1955. Wikipedia vermeldt Walt Disney Imagineering, Arrow Development voor de Disneyland-installatie, het teacups-ride-type en het systeem met drie kleinere draaischijven binnen een grote draaischijf.

Theming

Alice in Wonderland-thema rond de Mad Hatter's tea party, met oversized theekopjes, gekleurde lantaarns, disproportionate objects, unbirthday-muziek en een openlucht-Fantasyland-setting.

Data

Wait statistics

Based on available measurements and historical wait-time data.

Now Closed
Normal 5 min
Average 6 min
Highest measurement 25 min Measured at 17-06 18:23
Measurements 8309
Outage measurements 32
Avg. outage duration 11 min
Often busy 08:00 5 min average
Often quiet 08:00 5 min average
Reliability High 8363 measurements, 16 hour blocks
Distribution

Boxplots

Spread of wait times, outage duration, and the number of outages per day based on available historical data.

Wait times

8309 measurements

0 min 10 min 20 min 30 min
Min
0 min
Q1
5 min
Median
5 min
Q3
5 min
Max
25 min

Typical wait time: around 5 min.

It usually falls between 5 min and 5 min.

See more than 5 min? It is probably busier than usual — consider a quieter moment.

Less than 5 min? You are in luck: that does not happen often.

Outage duration

18 outages

0 min 15 min 30 min 45 min 60 min
Min
5 min
Q1
5 min
Median
6 min
Q3
11 min
Max
47 min

On average, an outage lasts about 6 min.

In three out of four cases, the attraction reopens within 11 min.

If it takes longer, expect extra waiting time.

Outages per day

10 days

0 1 2 3 4
Min
1
Q1
1
Median
2
Q3
2
Max
4

On days with outages, we see an average of 2 per day.

That usually falls between 1 and 2.

On quiet days it was 1, on busy days up to 4.

Historical

Wait-time build-up

Today compared with historical wait times by hour.

Today Expected Historical
Horizontal axis hours, vertical axis queue minutes. 0 min 5 min 10 min 15 min 20 min 08:00 11:00 14:00 17:00 20:00 23:00 00:00