

← Back to Bobbejaanland
Ride details

Revolution

Indoor Vekoma Illusion coaster in Adventure Valley with a 30-car train and a time-travel theme.

Revolution is an indoor coaster that takes its time to build, but its real signature is the unusually long train: sixty riders snake through the circular show building in one extended chain. The refreshed queue and lighting package push the story toward a secret time experiment that still feels only barely under control.

Normal 5 min
Average 15 min
Highest measurement 71 min Measured at 21-07 15:34
Type Ride
Category Roller coaster
Photos
RCDB

Coaster profile

View on RCDB

Classification

RCDB #917
RCDB status Operating since May 15, 1989
Classification Roller Coaster
Track type Steel
Design Sit Down
Scale Thrill
Layout Enclosed
Categories Roller Coaster, Steel, Sit Down, Thrill, Enclosed
Opening 15-05-1989
Soft opening 13-05-1989
Capaciteit 1.200 personen per uur
Afmetingen 157.5 ft (48.0 m) x 157.5 ft (48.0 m)

Tracks

Length 2,362.2 ft (720.0 m)
Height 60.7 ft (18.5 m)
Speed 31.1 mph (50.1 km/h)
Inversions 0
Ride duration 2:20

Trains

Arrangement 1 trein met 30 wagens; rijders zitten achter elkaar in 2 rijen, samen 60 rijders per trein.
Trains 1
Cars per train 30
Rows per car 2
Riders per row 1
Riders per train 60
Capacity per hour 1,200

Location

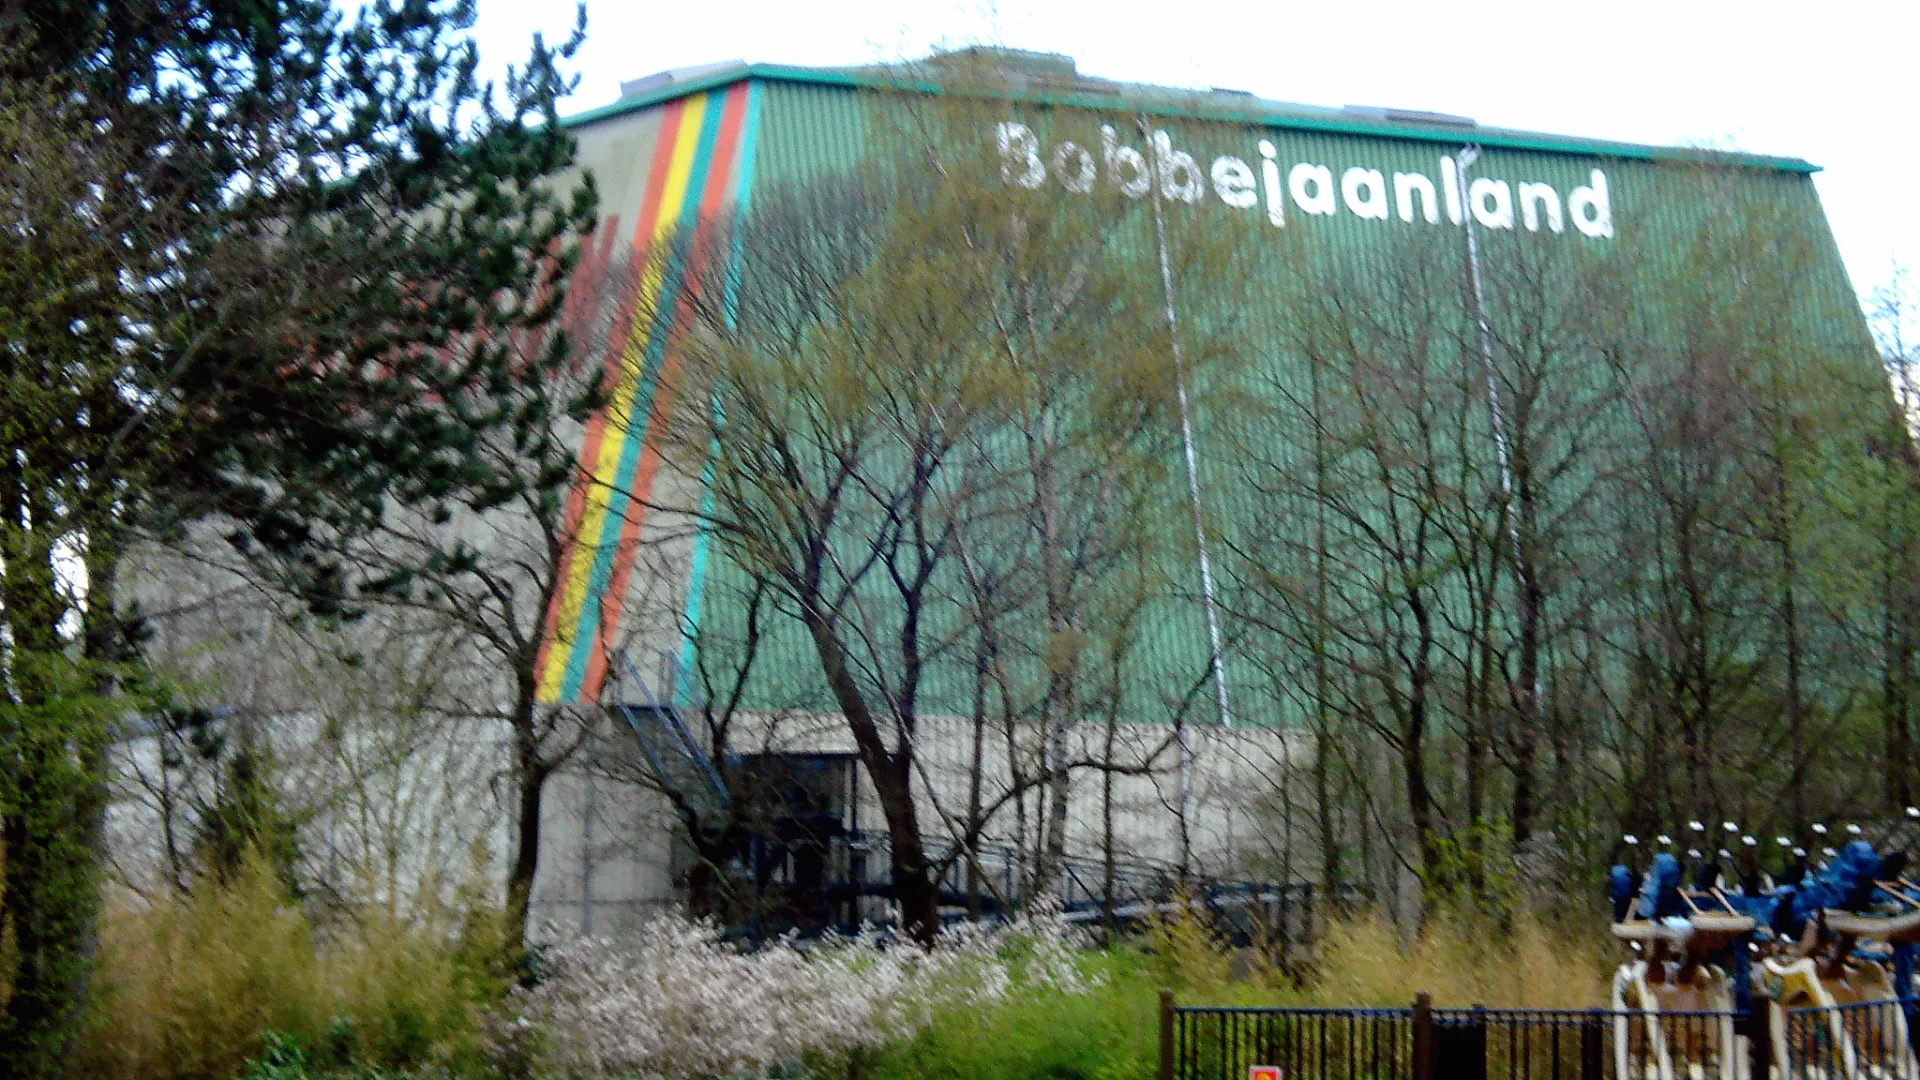
Revolution stands in Adventure Valley, with its round indoor hall built into the ride experience.

Notes

For its 35th anniversary, Revolution received a revamped queue, extra lighting scenes and a train refurbishment with a new chassis. The 2016 VR version, Mount Mara, disappeared at the start of the 2023 season.

Theming

Adventure Valley frames the ride as a secret project built around a time capsule and a giant clockwork machine powered by geothermal heat.

Data

Wait statistics

Based on available measurements and historical wait-time data.

Now 6 min
Normal 5 min
Average 15 min
Highest measurement 71 min Measured at 21-07 15:34
Measurements 1492
Outage measurements 154
Avg. outage duration 129 min
Often busy 14:00 16 min average
Often quiet 10:00 5 min average
Reliability High 1582 measurements, 11 hour blocks
Distribution

Boxplots

Spread of wait times, outage duration, and the number of outages per day based on available historical data.

Wait times

1492 measurements

0 min 20 min 40 min 60 min 80 min
Min
0 min
Q1
5 min
Median
10 min
Q3
25 min
Max
71 min

Typical wait time: around 10 min.

It usually falls between 5 min and 25 min.

See more than 25 min? It is probably busier than usual — consider a quieter moment.

Less than 5 min? You are in luck: that does not happen often.

Outage duration

48 outages

0 min 20 min 40 min 60 min 80 min
Min
2 min
Q1
5 min
Median
8 min
Q3
15 min
Max
71 min

On average, an outage lasts about 8 min.

In three out of four cases, the attraction reopens within 15 min.

If it takes longer, expect extra waiting time.

Outages per day

24 days

0 1 2 3 4
Min
1
Q1
2
Median
2
Q3
2
Max
4

On days with outages, we see an average of 2 per day.

That usually falls between 2 and 2.

On quiet days it was 1, on busy days up to 4.

Historical

Wait-time build-up

Today compared with historical wait times by hour.

Today Expected Historical
Horizontal axis hours, vertical axis queue minutes. 0 min 5 min 10 min 15 min 20 min 10:00 12:00 14:00 16:00 18:00 20:00 21:00