

← Back to Bobbejaanland
Ride details

Naga Bay

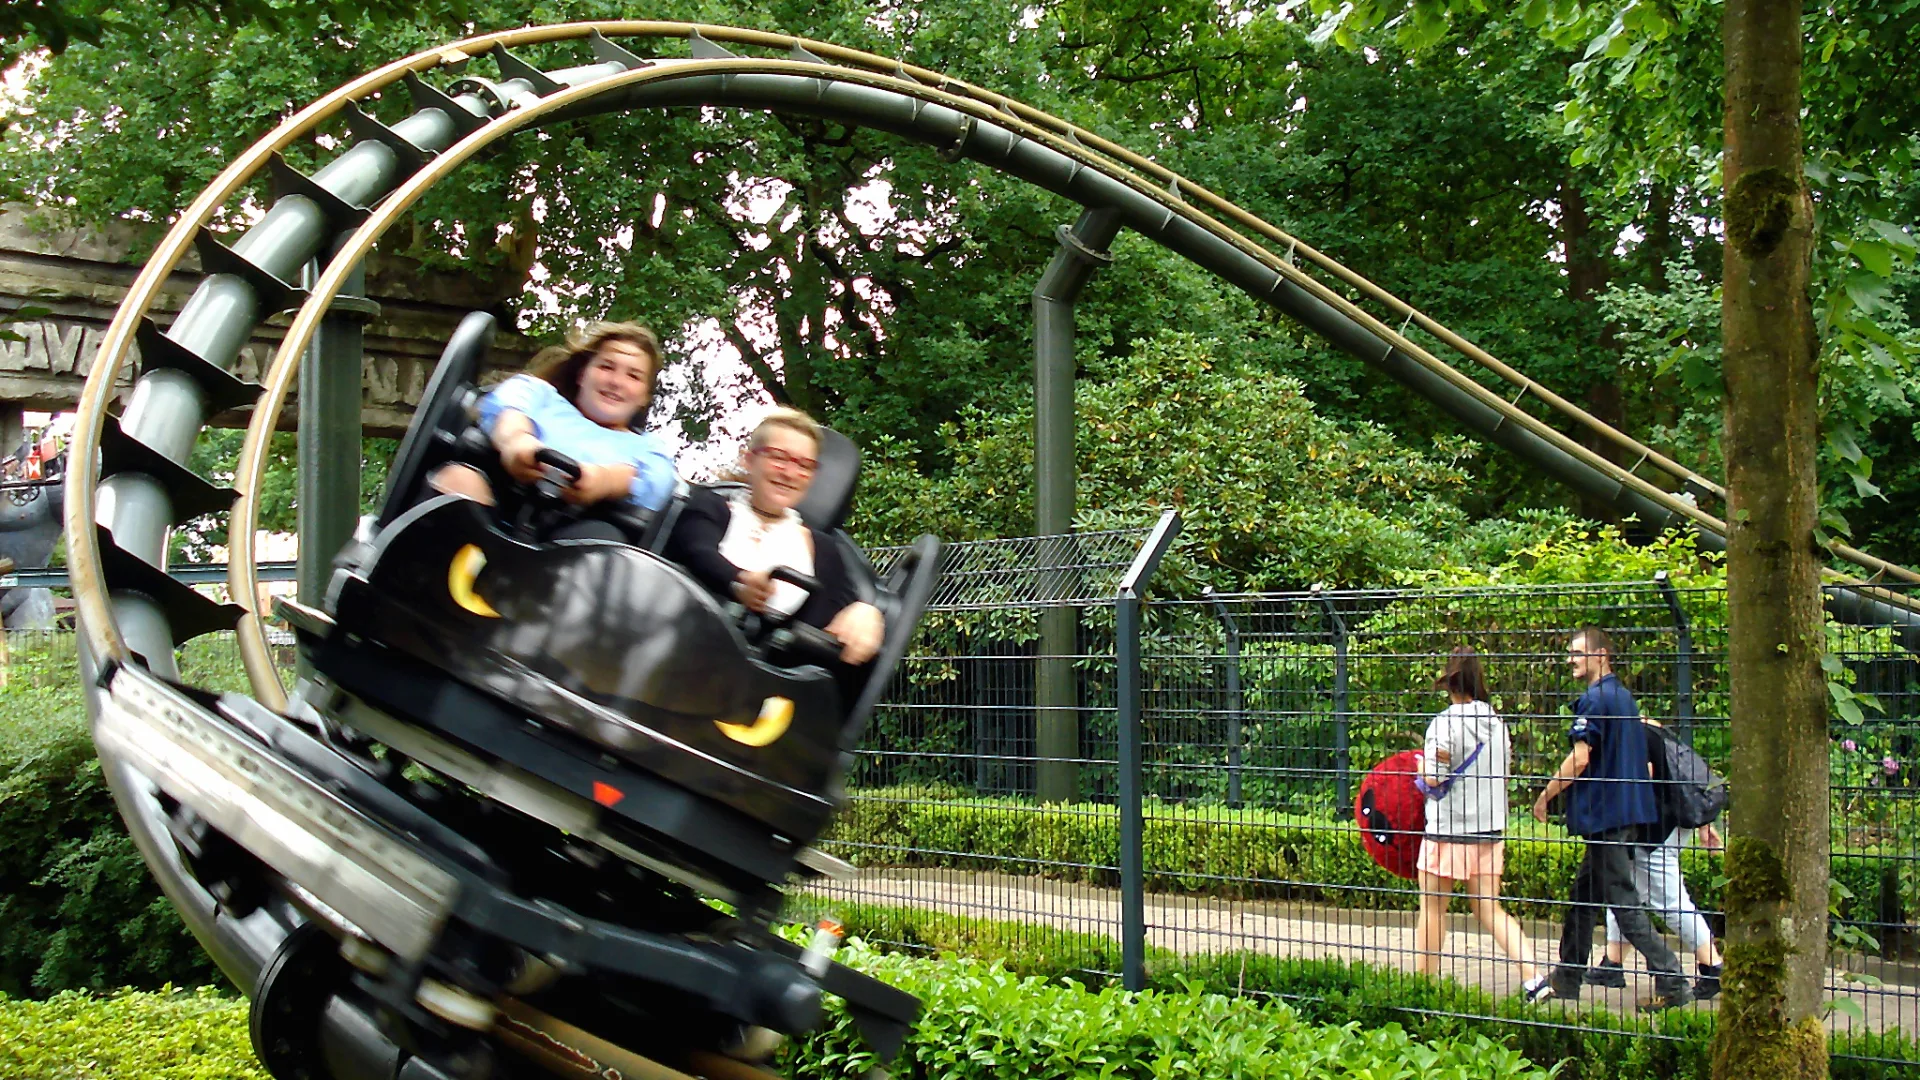
Maurer spinning coaster with four-seat cars that rotate freely between the trees of Adventure Valley.

Naga Bay pairs a compact coaster layout with spinning cars, so the ride never feels exactly the same twice. The coaster was previously known as Dizz, and its twists through the trees fit Adventure Valley's snaking atmosphere perfectly.

Normal 18 min
Average 19 min
Highest measurement 55 min Measured at 23-07 12:02
Type Ride
Category Roller coaster
Photos
RCDB

Coaster profile

View on RCDB

Classification

RCDB #9331
RCDB status Operating since April 9, 2011
Classification Roller Coaster
Track type Steel
Design Sit Down
Scale Thrill
Categories Roller Coaster, Steel, Sit Down, Thrill, Spinning Cars
Opening 09-04-2011
Voormalige naam Dizz
Capaciteit 800 personen per uur
Installateur RCS GmbH

Tracks

Length 1,410.8 ft (430.0 m)
Height 55.8 ft (17.0 m)
Speed 34.2 mph (55.0 km/h)
Inversions 0

Trains

Arrangement 6 losse draaiwagens; rijders zitten 2 naast elkaar in 2 rijen, samen 4 rijders per wagen.
Trains 6
Cars per train 1
Rows per car 2
Riders per row 2
Riders per train 4
Capacity per hour 800

Location

Naga Bay winds through Adventure Valley with spinning cars weaving between trees and park paths.

Notes

RCDB lists Dizz as the former name and RCS GmbH as the installer.

Theming

The official park framing leans into a snake-like ride experience: the cars spin and twist, so every ride can head in a different direction.

Data

Wait statistics

Based on available measurements and historical wait-time data.

Now 6 min
Normal 18 min
Average 19 min
Highest measurement 55 min Measured at 23-07 12:02
Measurements 1431
Outage measurements 171
Avg. outage duration 139 min
Often busy 11:00 29 min average
Often quiet 17:00 15 min average
Reliability High 1590 measurements, 11 hour blocks
Distribution

Boxplots

Spread of wait times, outage duration, and the number of outages per day based on available historical data.

Wait times

1431 measurements

0 min 15 min 30 min 45 min 60 min
Min
5 min
Q1
10 min
Median
20 min
Q3
26 min
Max
55 min

Typical wait time: around 20 min.

It usually falls between 10 min and 26 min.

See more than 26 min? It is probably busier than usual — consider a quieter moment.

Less than 10 min? You are in luck: that does not happen often.

Outage duration

51 outages

0 min 30 min 60 min 90 min 120 min
Min
2 min
Q1
5 min
Median
10 min
Q3
26 min
Max
107 min

Outages usually last about 10 min.

Some are over quickly (sometimes within 5 min), others take longer (up to 26 min). That varies per outage.

Already longer than 26 min? The attraction may stay closed a while longer.

Outages per day

24 days

0 2 4 6
Min
1
Q1
2
Median
2
Q3
2
Max
5

On days with outages, we see an average of 2 per day.

That usually falls between 2 and 2.

On quiet days it was 1, on busy days up to 5.

Historical

Wait-time build-up

Today compared with historical wait times by hour.

Today Expected Historical
Horizontal axis hours, vertical axis queue minutes. 0 min 10 min 20 min 30 min 10:00 12:00 14:00 16:00 18:00 20:00 21:00