

← Back to Blackpool Pleasure Beach
Ride details

Wallace & Gromit's Thrill-o-Matic

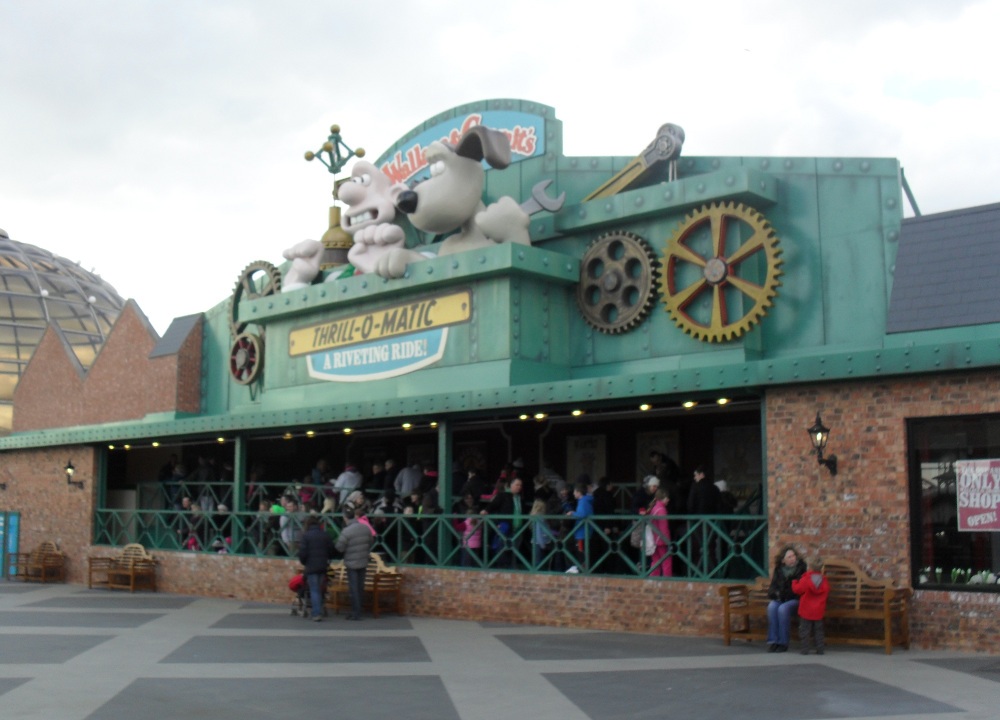
Wallace & Gromit's Thrill-o-Matic is an indoor tracked dark ride from 2013 with slipper cars and a 902-foot track.

Wallace & Gromit's Thrill-o-Matic is a gentle dark ride through the world of Aardman's inventor and his loyal dog. The route uses the former Gold Mine infrastructure, but was rebuilt with new vehicles, scenes and film-inspired theming. Riders board large slipper cars and pass familiar moments from the Wallace & Gromit stories.

Normal 15 min
Average 14 min
Highest measurement 55 min Measured at 16-07 14:59
Type Ride
Category Dark Ride
Photos
RCDB

Coaster profile

Classification

Scale low
Opening current theme 29 april 2013
Original ride system opened 1971 as Gold Mine
Cost 5,250,000 GBP
Vehicles Single car; 4 riders per vehicle
Overhauled by W.G.H. Transportation Engineering
Theming Aardman Animations
Source Aardman; Coasterpedia; Wikipedia; Dark Ride Database

Tracks

Length 902.2 ft (275.0 m)
Ride duration 4:00

Trains

Arrangement Losse slipperwagens met 2 rijen van 2 rijders, totaal 4 rijders per wagen.
Rows per car 2
Riders per row 2
Riders per train 4

Notes

The current attraction opened on 29 April 2013 as a rebuild and retheme of Gold Mine. Coasterpedia lists Arrow Development, a 902-foot track, four riders per car and W.G.H. Transportation Engineering for the overhaul, while Aardman confirms the slipper-car concept and the Wallace & Gromit film scenes.

Theming

The ride is based on Wallace & Gromit and mixes slipper cars, film clips and scenes from several Aardman stories. New additions tied to Vengeance Most Fowl were announced in 2025.

Data

Wait statistics

Based on available measurements and historical wait-time data.

Now Closed
Normal 15 min
Average 14 min
Highest measurement 55 min Measured at 16-07 14:59
Measurements 1208
Outage measurements 2
Avg. outage duration 8 min
Often busy 10:00 15 min average
Often quiet 18:00 10 min average
Reliability High 1276 measurements, 12 hour blocks
Distribution

Boxplots

Spread of wait times, outage duration, and the number of outages per day based on available historical data.

Wait times

1208 measurements

0 min 15 min 30 min 45 min 60 min
Min
0 min
Q1
10 min
Median
15 min
Q3
15 min
Max
55 min

Typical wait time: around 15 min.

It usually falls between 10 min and 15 min.

See more than 15 min? It is probably busier than usual — consider a quieter moment.

Less than 10 min? You are in luck: that does not happen often.

Outage duration

2 outages

0 min 3 min 6 min 9 min 12 min
Min
5 min
Q1
6 min
Median
8 min
Q3
9 min
Max
10 min

On average, an outage lasts about 8 min.

In three out of four cases, the attraction reopens within 9 min.

If it takes longer, expect extra waiting time.

Outages per day

1 day

0 1 2
Min
2
Q1
2
Median
2
Q3
2
Max
2

On days with outages, we see an average of 2 per day.

That usually falls between 2 and 2.

On quiet days it was 2, on busy days up to 2.

Historical

Wait-time build-up

Today compared with historical wait times by hour.

Today Expected Historical
Horizontal axis hours, vertical axis queue minutes. 0 min 5 min 10 min 15 min 20 min 10:00 12:00 14:00 16:00 18:00 20:00 21:00