

← Back to Blackpool Pleasure Beach
Ride details

Revolution

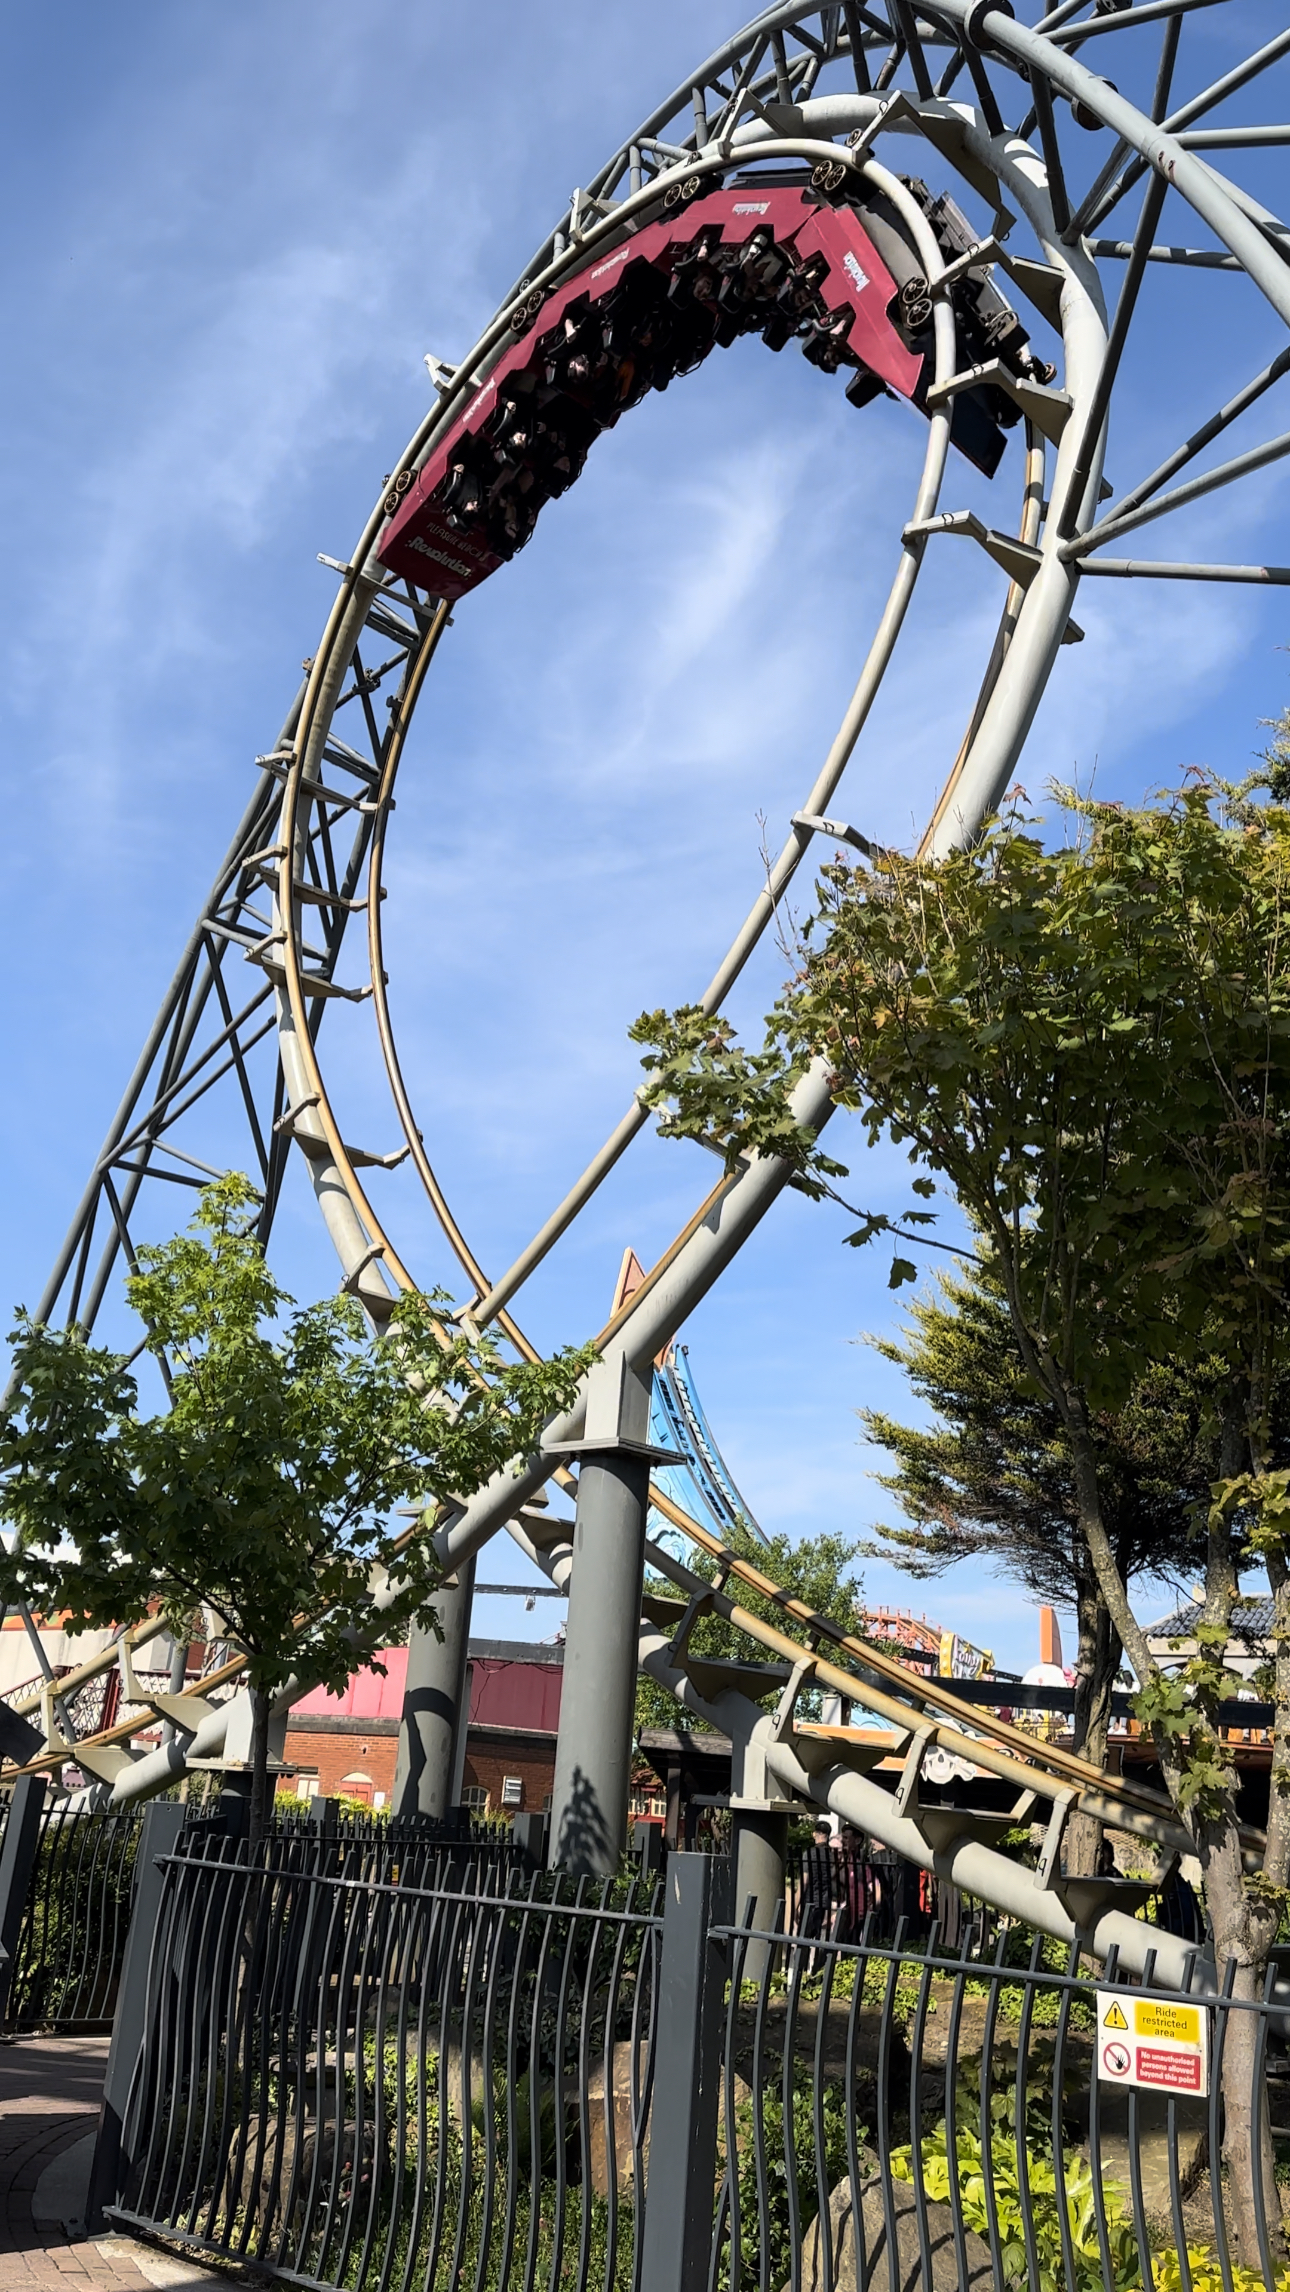
Revolution is an Arrow shuttle loop that launches you forward through the loop, then sends you back through the same forces in reverse.

Revolution keeps things simple and effective: from an elevated station, you're launched through the loop and up the spike on the far side. Then you run the same course in reverse. That mirrored layout makes the short ride hit hard, especially with the open setting and the distinctive cantilever support structure.

Normal 13 min
Average 20 min
Highest measurement 90 min Measured at 15-07 14:22
Type Ride
Category Roller coaster
Photos
RCDB

Coaster profile

View on RCDB

Classification

RCDB #788
RCDB status Operating since June 18, 1979
Classification Roller Coaster
Track type Steel
Design Shuttle Loop
Scale Extreme
Layout Shuttle
Categories Roller Coaster, Steel, Sit Down, Extreme, Shuttle Loop, Shuttle
G-force 4G
Opening year 1979
Official listed speed 34.8 mi (56.0 km)/h
Official listed duration 1:20
Former name Irn-Bru Revolution

Tracks

Length 635.0 ft (193.6 m)
Height 56.0 ft (17.1 m)
Drop 47.0 ft (14.3 m)
Speed 45.0 mph (72.4 km/h)
Inversions 1
Ride duration 1:06

Trains

Arrangement 1 trein met 4 wagens; rijders zitten 2 naast elkaar in 2 rijen, samen 16 rijders per trein.
Trains 1
Cars per train 4
Rows per car 2
Riders per row 2
Riders per train 16
Capacity per hour 414

Location

At Pleasure Beach Resort, Revolution stands out as a compact steel shuttle loop with striking elevated end sections.

Notes

RCDB lists a track length of 635 feet, a height of 56 feet, a 47-foot drop, a top speed of 45 mph, 1 inversion, a 1:06 ride time, 4 Gs and a train for 16 riders. The official park page adds 1979, Arrow Dynamics, 414 riders per hour and a public-facing duration of 1:20.

Theming

A futuristic gunmetal-grey makeover from 2012 with white accents and a red train.

Data

Wait statistics

Based on available measurements and historical wait-time data.

Now Closed
Normal 13 min
Average 20 min
Highest measurement 90 min Measured at 15-07 14:22
Measurements 1182
Outage measurements 12
Avg. outage duration 18 min
Often busy 12:00 20 min average
Often quiet 19:00 5 min average
Reliability High 1258 measurements, 12 hour blocks
Distribution

Boxplots

Spread of wait times, outage duration, and the number of outages per day based on available historical data.

Wait times

1182 measurements

0 min 25 min 50 min 75 min 100 min
Min
0 min
Q1
10 min
Median
15 min
Q3
25 min
Max
90 min

Typical wait time: around 15 min.

It usually falls between 10 min and 25 min.

See more than 25 min? It is probably busier than usual — consider a quieter moment.

Less than 10 min? You are in luck: that does not happen often.

Outage duration

4 outages

0 min 15 min 30 min 45 min
Min
5 min
Q1
5 min
Median
13 min
Q3
26 min
Max
42 min

On average, an outage lasts about 13 min.

In three out of four cases, the attraction reopens within 26 min.

If it takes longer, expect extra waiting time.

Outages per day

2 days

0 1 2
Min
2
Q1
2
Median
2
Q3
2
Max
2

On days with outages, we see an average of 2 per day.

That usually falls between 2 and 2.

On quiet days it was 2, on busy days up to 2.

Historical

Wait-time build-up

Today compared with historical wait times by hour.

Today Expected Historical
Horizontal axis hours, vertical axis queue minutes. 0 min 5 min 10 min 15 min 20 min 10:00 12:00 14:00 16:00 18:00 20:00 21:00