

← Back to Blackpool Pleasure Beach
Ride details

Grand National

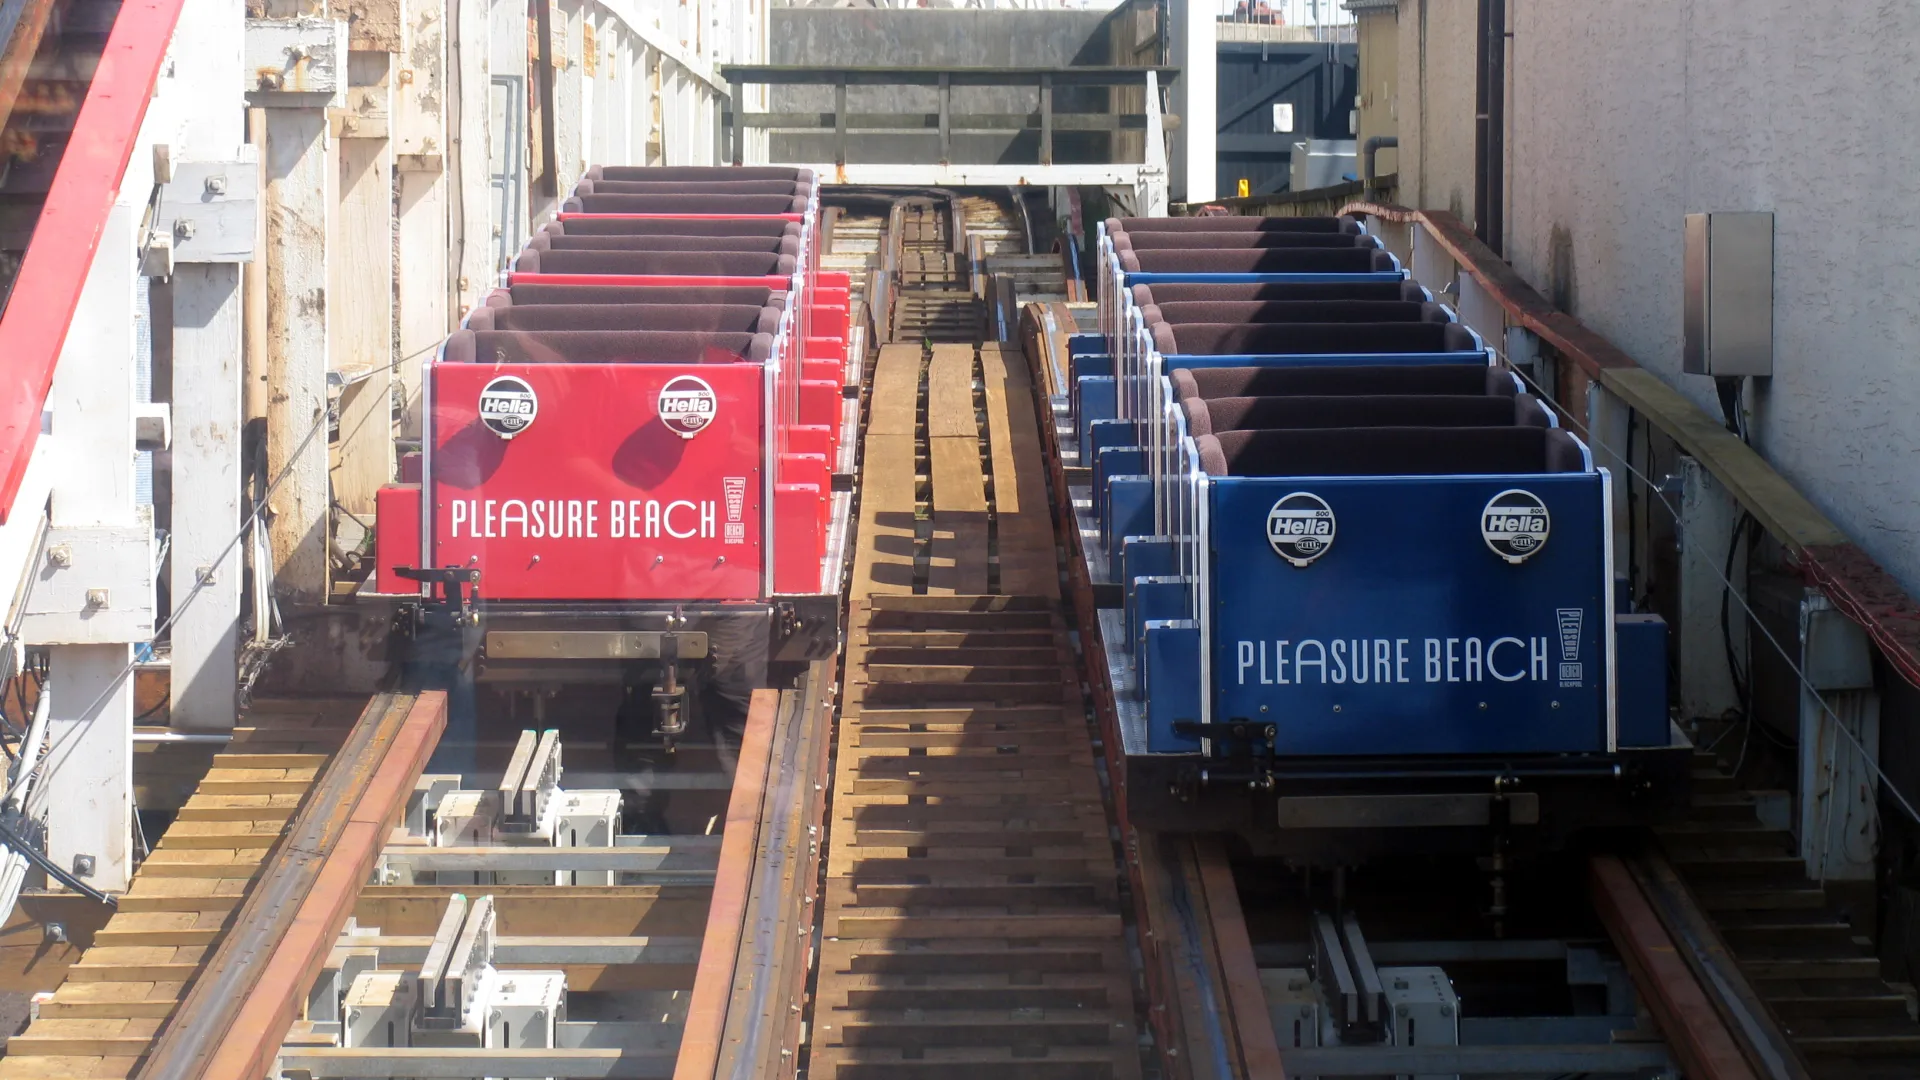
Wooden Möbius racing coaster from 1935 where two trains chase each other around one continuous track.

Grand National turns a wooden roller coaster into a race. The two trains leave at the same time, weave through the Möbius layout and return to the opposite side of the station, so the duel is told not just side by side but through the track design itself.

Normal 18 min
Average 23 min
Highest measurement 125 min Measured at 15-07 12:41
Type Ride
Category Roller coaster
Photos
RCDB

Coaster profile

View on RCDB

Classification

RCDB #792
RCDB status Operating since June 18, 2026
Classification Roller Coaster
Track type Wood
Design Mobius
Scale Thrill
Layout Mobius racing
Categories Roller Coaster, Wood, Sit Down, Thrill, Mobius
Restraints Individual ratcheting lap bar, Seat divider, Seatbelt
Opening year 1935
Official listed total track 6,604.0 ft (2,012.9 m)
Official listed speed 45.0 mph (72.4 km/h)
Official listed duration 3:00
Heritage listing Grade II, 2017-04-19

Tracks

Length 3,302.0 ft (1,006.5 m)
Height 62.0 ft (18.9 m)
Speed 40.0 mph (64.4 km/h)
Inversions 0
Ride duration 2:20

Trains

Arrangement 4 treinen met 3 wagens per trein; rijders zitten 2 naast elkaar in 3 rijen, samen 18 rijders per trein.
Trains 4
Cars per train 3
Rows per car 3
Riders per row 2
Riders per train 18
Capacity per hour 720

Elements

Status history

  • closed from May 20, 2004 through October 28, 2004

Location

Grand National stands at Pleasure Beach Resort as part of the park's historic collection of wooden coasters.

Notes

RCDB lists 3,302 ft of track, a height of 62 ft, 40 mph, 0 inversions, a 2:20 ride time, four trains with 18 riders each and individual ratcheting lap bars with seat dividers and seat belts. The official park page lists 3,302 ft per side, 6,604 ft in total, 45 mph, 3 minutes and 720 riders per hour.

Theming

Classic horse-racing theme, Art Deco station history and a layout that turns the name Grand National into a wooden coaster contest.

Data

Wait statistics

Based on available measurements and historical wait-time data.

Now Closed
Normal 18 min
Average 23 min
Highest measurement 125 min Measured at 15-07 12:41
Measurements 942
Outage measurements 0
Avg. outage duration -
Often busy 10:00 25 min average
Often quiet 17:00 15 min average
Reliability High 960 measurements, 12 hour blocks
Distribution

Boxplots

Spread of wait times, outage duration, and the number of outages per day based on available historical data.

Wait times

942 measurements

0 min 40 min 80 min 120 min 160 min
Min
0 min
Q1
15 min
Median
20 min
Q3
25 min
Max
125 min

Typical wait time: around 20 min.

It usually falls between 15 min and 25 min.

See more than 25 min? It is probably busier than usual — consider a quieter moment.

Less than 15 min? You are in luck: that does not happen often.

Outage duration

Not enough data yet for a boxplot.

This attraction has not reported any outages to us yet. We cannot say anything meaningful about it here.

Outages per day

Not enough data yet for a boxplot.

This attraction has not reported any outages to us yet. We cannot say anything meaningful about it here.

Historical

Wait-time build-up

Today compared with historical wait times by hour.

Today Expected Historical
Horizontal axis hours, vertical axis queue minutes. 0 min 10 min 20 min 30 min 10:00 12:00 14:00 16:00 18:00 20:00 21:00