

← Back to Blackpool Pleasure Beach
Ride details

Avatar Airbender

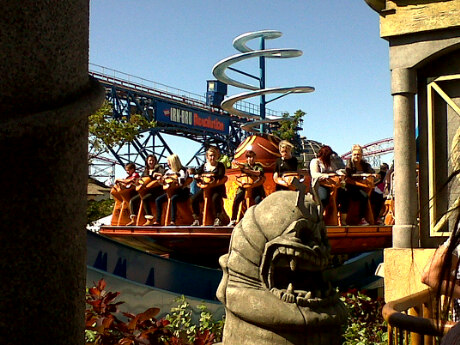
Avatar Airbender is a Zamperla Mega Disk'O in Nickelodeon Land, with 24 outward-facing seats and a spinning, swinging ride pattern.

Avatar Airbender quite literally puts the element of air in motion: the disk spins while the vehicle swings back and forth along the track. It is more compact than a roller coaster, but the open seating and sideways pendulum motion make it feel noticeably more intense than most of the children's rides in Nickelodeon Land.

Normal 8 min
Average 13 min
Highest measurement 60 min Measured at 15-07 15:43
Type Ride
Category Spinning Ride
Photos
RCDB

Coaster profile

Classification

Scale thrill
Opening 2011
Product Mega Disk'O 24
Zitplaatsen 24 per cyclus
Minimumlengte 120 cm
Producthoogte 47.2 ft (14.4 m)
Theoretische capaciteit product 600 personen per uur
Nickelodeon Land geopend 4 mei 2011
Bronnen Pleasure Beach Resort; Coasterpedia; Zamperla; Wikipedia

Tracks

Length 156.2 ft (47.6 m)
Height 47.2 ft (14.4 m)

Trains

Arrangement 1 draaiende Mega Disk'O-schijf met 24 naar buiten gerichte zitplaatsen.
Trains 1
Riders per train 24
Capacity per hour 600

Notes

Avatar Airbender opened in 2011 as part of Nickelodeon Land. Coasterpedia identifies the attraction as a Zamperla Mega Disk'O with 24 seats per cycle, while Zamperla model data for the Mega Disk'O 24 lists a 156-foot track, a height of 47 feet and a capacity of 600 riders per hour.

Theming

The attraction references Avatar: The Last Airbender and uses its spinning, rolling motion as a physical nod to airbending.

Data

Wait statistics

Based on available measurements and historical wait-time data.

Now Closed
Normal 8 min
Average 13 min
Highest measurement 60 min Measured at 15-07 15:43
Measurements 1120
Outage measurements 14
Avg. outage duration 36 min
Often busy 14:00 15 min average
Often quiet 10:00 5 min average
Reliability High 1184 measurements, 12 hour blocks
Distribution

Boxplots

Spread of wait times, outage duration, and the number of outages per day based on available historical data.

Wait times

1120 measurements

0 min 15 min 30 min 45 min 60 min
Min
0 min
Q1
5 min
Median
10 min
Q3
20 min
Max
60 min

Typical wait time: around 10 min.

It usually falls between 5 min and 20 min.

See more than 20 min? It is probably busier than usual — consider a quieter moment.

Less than 5 min? You are in luck: that does not happen often.

Outage duration

3 outages

0 min 25 min 50 min 75 min 100 min
Min
5 min
Q1
13 min
Median
20 min
Q3
51 min
Max
82 min

Outages usually last about 20 min.

Some are over quickly (sometimes within 13 min), others take longer (up to 51 min). That varies per outage.

Already longer than 51 min? The attraction may stay closed a while longer.

Outages per day

2 days

0 1 2
Min
1
Q1
1
Median
2
Q3
2
Max
2

On days with outages, we see an average of 2 per day.

That usually falls between 1 and 2.

On quiet days it was 1, on busy days up to 2.

Historical

Wait-time build-up

Today compared with historical wait times by hour.

Today Expected Historical
Horizontal axis hours, vertical axis queue minutes. 0 min 5 min 10 min 15 min 20 min 10:00 12:00 14:00 16:00 18:00 20:00 21:00