

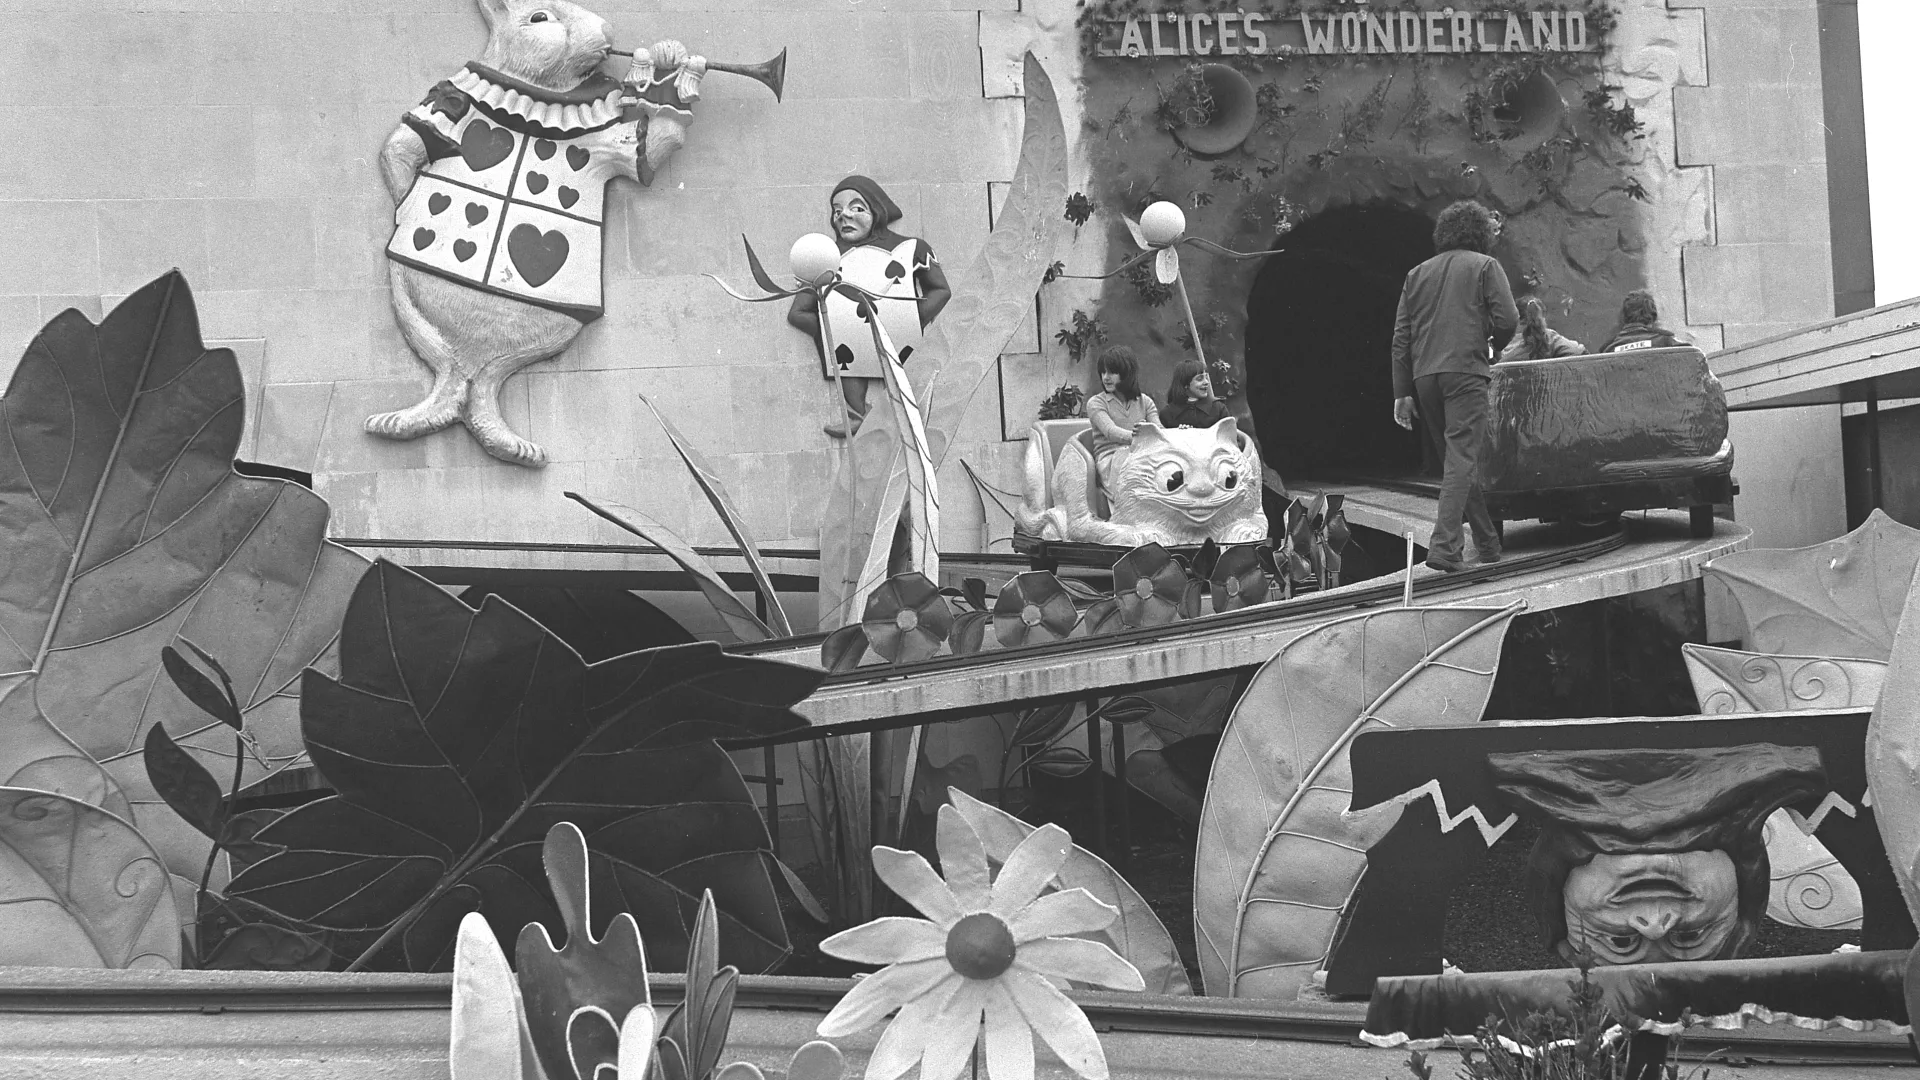
Tim Burton does not skip Alice in Wonderland during Blackpool visit
Filmmaker Tim Burton visited Blackpool Pleasure Beach and also rode Alice in Wonderland. Because of his own connection to the story through the 2010 live-action film, the classic dark ride received an extra layer of cultural attention.
More context
In October 2023, Looopings reported that Tim Burton had appeared at Blackpool Pleasure Beach. The internationally known filmmaker was shown around several attractions, including The Big One, Steeplechase and the Halloween event Journey to Hell. The historic Ghost Train received special attention, but one detail mattered most for Alice in Wonderland: Burton did not skip the dark ride. That made the visit more than a simple celebrity photo opportunity. Burton has his own connection to the Alice story, having directed Disney's 2010 live-action version of Alice in Wonderland. His stop at the ride therefore added a cultural layer to the attraction: a director who created a modern film interpretation of the story visited Blackpool's classic theme-park version. For guests and fans, the moment underlined how widely recognisable the theme remains beyond the amusement-park world. Alice in Wonderland is already a nostalgic family ride within Pleasure Beach, but the news showed that it also belongs to a broader pop-cultural memory. The article was not about technical changes or a refurbishment. Its value was in the recognition: an older dark ride was briefly connected to a filmmaker who helped bring the same story back to global cinema audiences.