

← Back to Bellewaerde
Ride details

Screaming Eagle

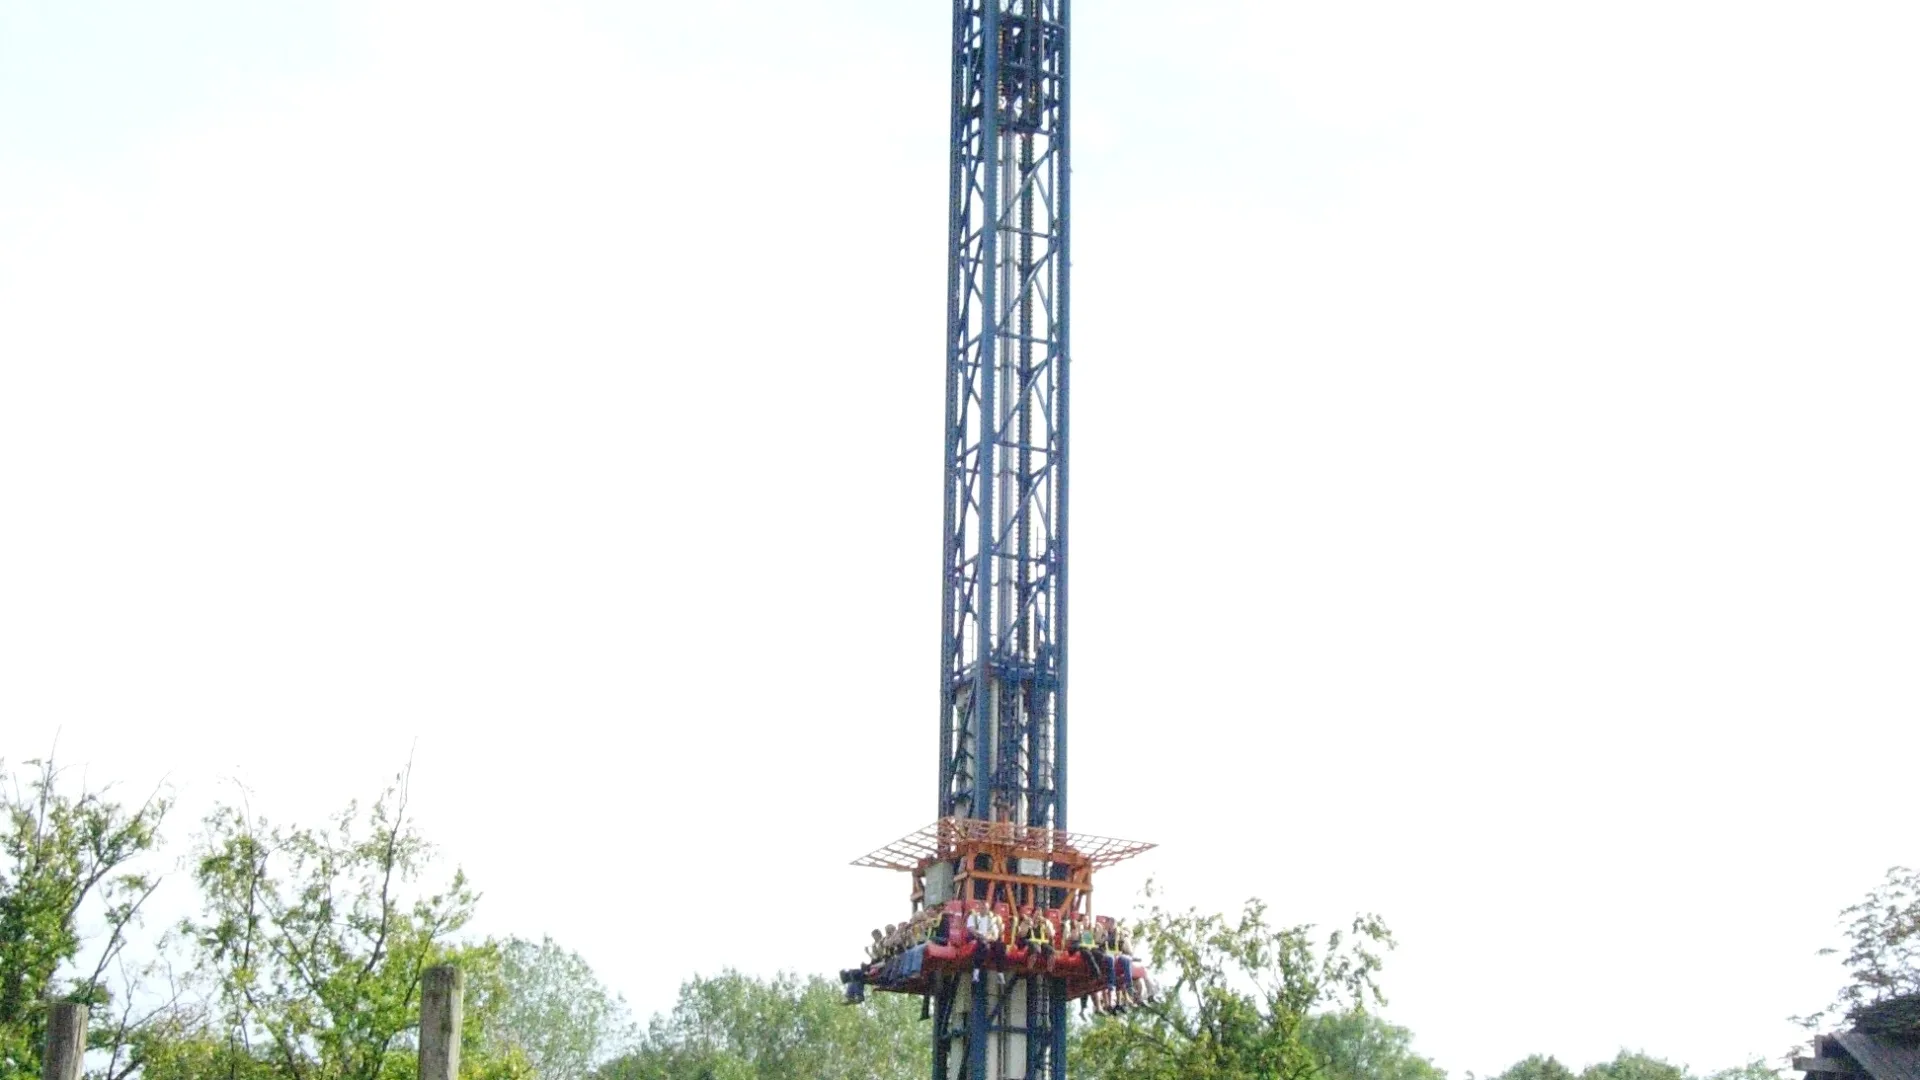
Screaming Eagle is Bellewaerde's 171-foot HUSS Shot'n Drop tower, combining a launch, a free fall and a top speed of 43.5 mph.

Screaming Eagle is Bellewaerde's vertical adrenaline hit. The gondola blasts up the tower, hovers briefly above the Canada area and then drops back down with a free-fall jolt. The ride arrived in 1999 and, at 171 feet tall, still stands out as one of Bellewaerde's clearest thrill icons.

Normal 5 min
Average 8 min
Highest measurement 30 min Measured at 31-07 14:03
Type Ride
Category Drop Tower
Photos
RCDB

Coaster profile

Classification

Scale thrill
Ride type Launched freefall tower
Model Shot'n Drop
Built/Opened 1999
Height 170.6 ft (52.0 m)
Max speed 43.5 mi (70.0 km)/h
Capacity 500 riders per hour
Maximum height 195 cm
Sources Bellewaerde; Pretparken.be; Coasterpedia; Wikipedia; Scream Machine

Tracks

Height 170.6 ft (52.0 m)
Speed 43.5 mph (70.0 km/h)
Ride duration 1:00

Trains

Arrangement 1 Shot'n Drop-gondel met maximaal 24 rijders per cyclus.
Trains 1
Riders per train 24
Capacity per hour 500

Location

Screaming Eagle stands in the Canada area and, thanks to its height, is easy to spot even outside the park.

Notes

Bellewaerde lists a 4 ft 7 in minimum height, a 6 ft 5 in maximum height, 43.5 mph top speed, 171-foot height, 500 riders per hour, a 1999 opening year and its location in Canada. Pretparken.be also confirms the HUSS Shot'n Drop model, a 1-minute ride cycle and a single gondola with 24 passengers.

Theming

The attraction uses its eagle name mainly as a thrill cue: a sharp climb, a brief hover and a hard drop back down.

Data

Wait statistics

Based on available measurements and historical wait-time data.

Now Closed
Normal 5 min
Average 8 min
Highest measurement 30 min Measured at 31-07 14:03
Measurements 1371
Outage measurements 0
Avg. outage duration -
Often busy 15:00 10 min average
Often quiet 10:00 5 min average
Reliability High 1464 measurements, 12 hour blocks
Distribution

Boxplots

Spread of wait times, outage duration, and the number of outages per day based on available historical data.

Wait times

1371 measurements

0 min 10 min 20 min 30 min
Min
5 min
Q1
5 min
Median
5 min
Q3
10 min
Max
30 min

Typical wait time: around 5 min.

It usually falls between 5 min and 10 min.

See more than 10 min? It is probably busier than usual — consider a quieter moment.

Less than 5 min? You are in luck: that does not happen often.

Outage duration

Not enough data yet for a boxplot.

This attraction has not reported any outages to us yet. We cannot say anything meaningful about it here.

Outages per day

Not enough data yet for a boxplot.

This attraction has not reported any outages to us yet. We cannot say anything meaningful about it here.

Historical

Wait-time build-up

Today compared with historical wait times by hour.

Today Expected Historical
Horizontal axis hours, vertical axis queue minutes. 0 min 5 min 10 min 15 min 20 min 10:00 12:00 14:00 16:00 18:00 20:00 22:00