

← Back to Bellewaerde
Ride details

El Volador

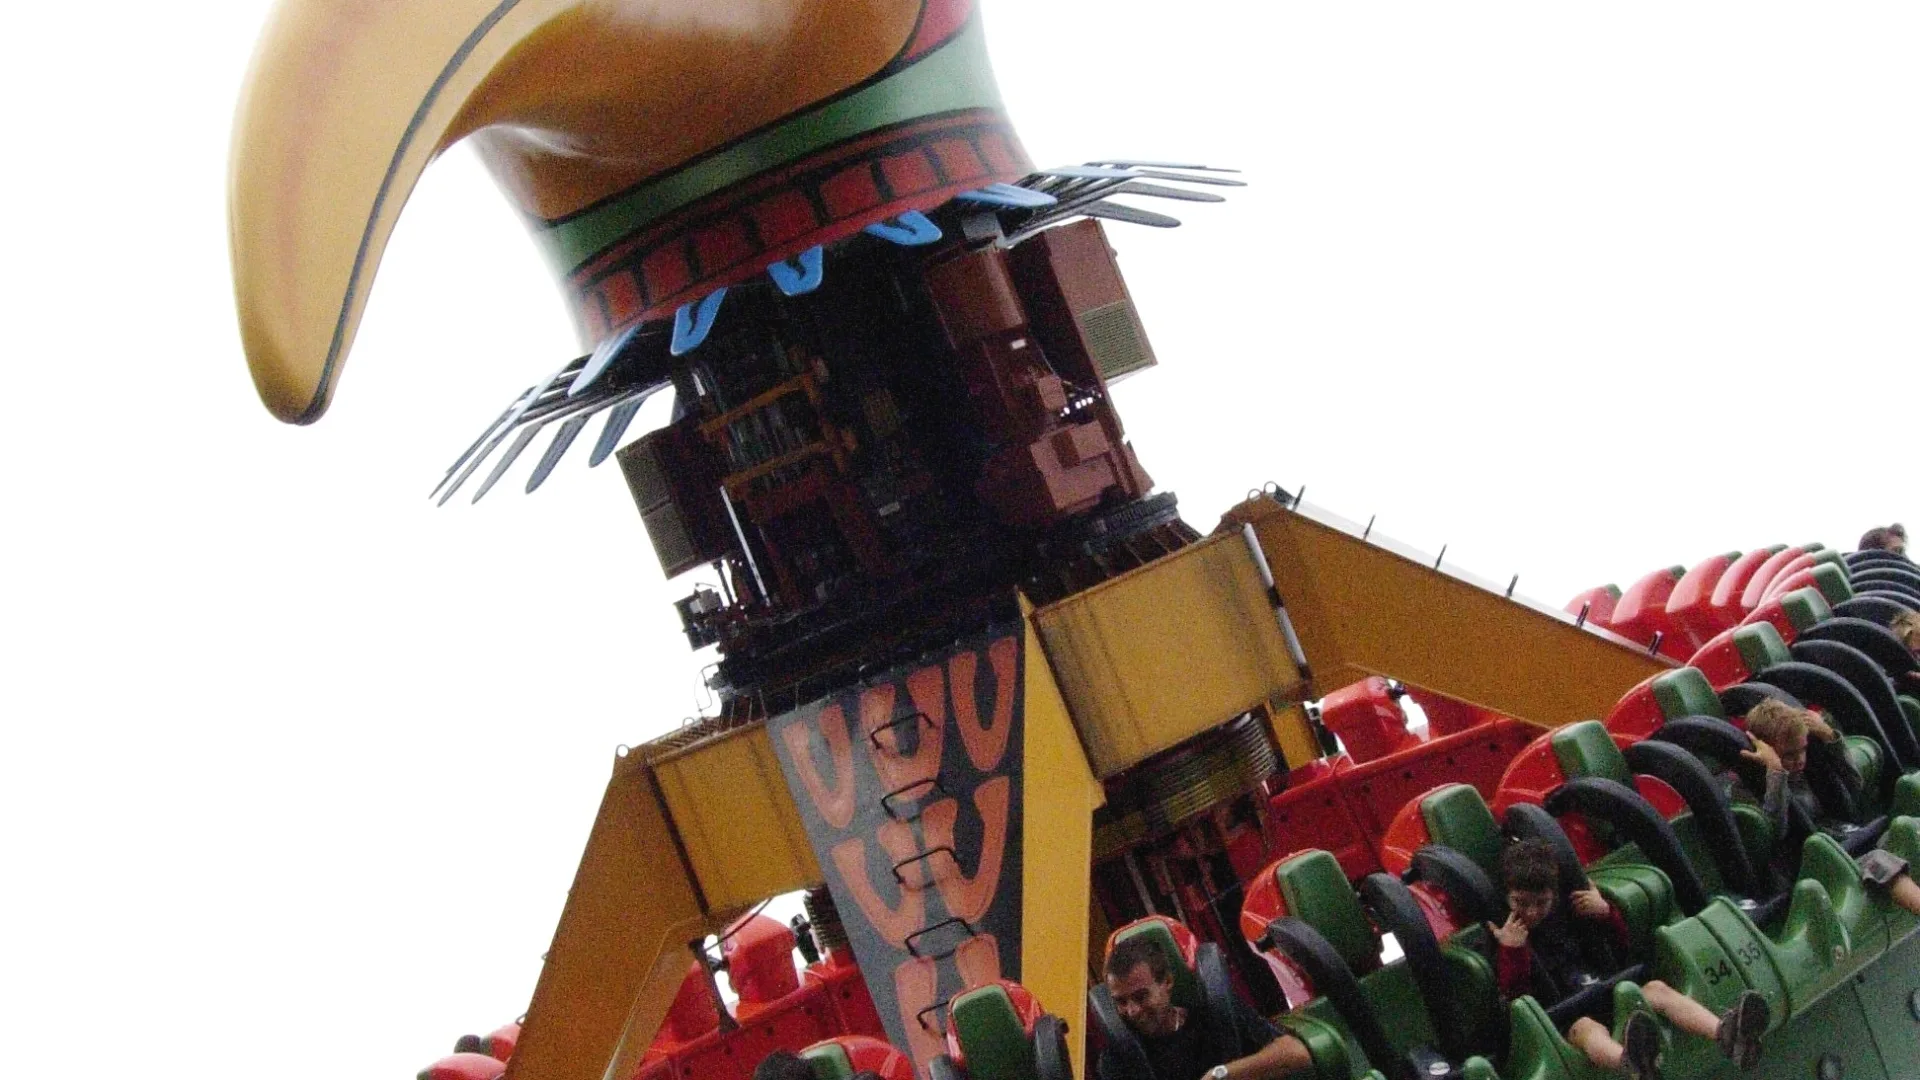
El Volador is Bellewaerde's HUSS Topple Tower in the Mexicoplein area, with 40 seats and a tilting ride cycle that reaches 52 feet.

El Volador looks like a tower ride, but it feels nothing like a standard drop attraction. The circular gondola climbs, spins and then tilts with the tower, so the square keeps reappearing beneath you from a different angle. That makes the ride stand out: not brutally fast, but unusual, airy and instantly recognizable within Bellewaerde.

Normal 5 min
Average 6 min
Highest measurement 40 min Measured at 28-06 11:46
Type Ride
Category Aerial Ride
Photos
RCDB

Coaster profile

Classification

Scale family
Attractietype Topple Tower
Bouwjaar volgens Bellewaerde 2007
Opening volgens Coasterpedia/Wikipedia 2005
Hoogte 52.5 ft (16.0 m)
Zitplaatsen 40
Capaciteit 420 personen per uur
Kostprijs volgens Coasterpedia 2,5 miljoen euro
Maximumlengte 195 cm
Bronnen Bellewaerde; Coasterpedia; Wikipedia; HUSS

Tracks

Height 52.5 ft (16.0 m)

Trains

Arrangement 1 ronde Topple Tower-gondel met maximaal 40 rijders.
Riders per train 40
Capacity per hour 420

Notes

Bellewaerde lists a minimum height of 3 ft 11 in, a maximum height of 6 ft 5 in, a height of 52 feet, a capacity of 420 riders per hour and an opening year of 2007. Coasterpedia cites HUSS Park Attractions, Topple Tower, 40 riders and 2005; because those opening years conflict, opened_at stays empty.

Theming

The ride in Bellewaerde's Mexicoplein area revolves around a colorful bird head and tips the gondola high above the square.

Data

Wait statistics

Based on available measurements and historical wait-time data.

Now Closed
Normal 5 min
Average 6 min
Highest measurement 40 min Measured at 28-06 11:46
Measurements 1009
Outage measurements 0
Avg. outage duration -
Often busy 11:00 8 min average
Often quiet 10:00 5 min average
Reliability High 1084 measurements, 12 hour blocks
Distribution

Boxplots

Spread of wait times, outage duration, and the number of outages per day based on available historical data.

Wait times

1009 measurements

0 min 10 min 20 min 30 min 40 min
Min
0 min
Q1
5 min
Median
5 min
Q3
5 min
Max
40 min

Typical wait time: around 5 min.

It usually falls between 5 min and 5 min.

See more than 5 min? It is probably busier than usual — consider a quieter moment.

Less than 5 min? You are in luck: that does not happen often.

Outage duration

Not enough data yet for a boxplot.

This attraction has not reported any outages to us yet. We cannot say anything meaningful about it here.

Outages per day

Not enough data yet for a boxplot.

This attraction has not reported any outages to us yet. We cannot say anything meaningful about it here.

Historical

Wait-time build-up

Today compared with historical wait times by hour.

Today Expected Historical
Horizontal axis hours, vertical axis queue minutes. 0 min 5 min 10 min 15 min 20 min 10:00 12:00 14:00 16:00 18:00 20:00 22:00