

← Back to Alton Towers
Ride details

Monorail to Hotels & Car Parks

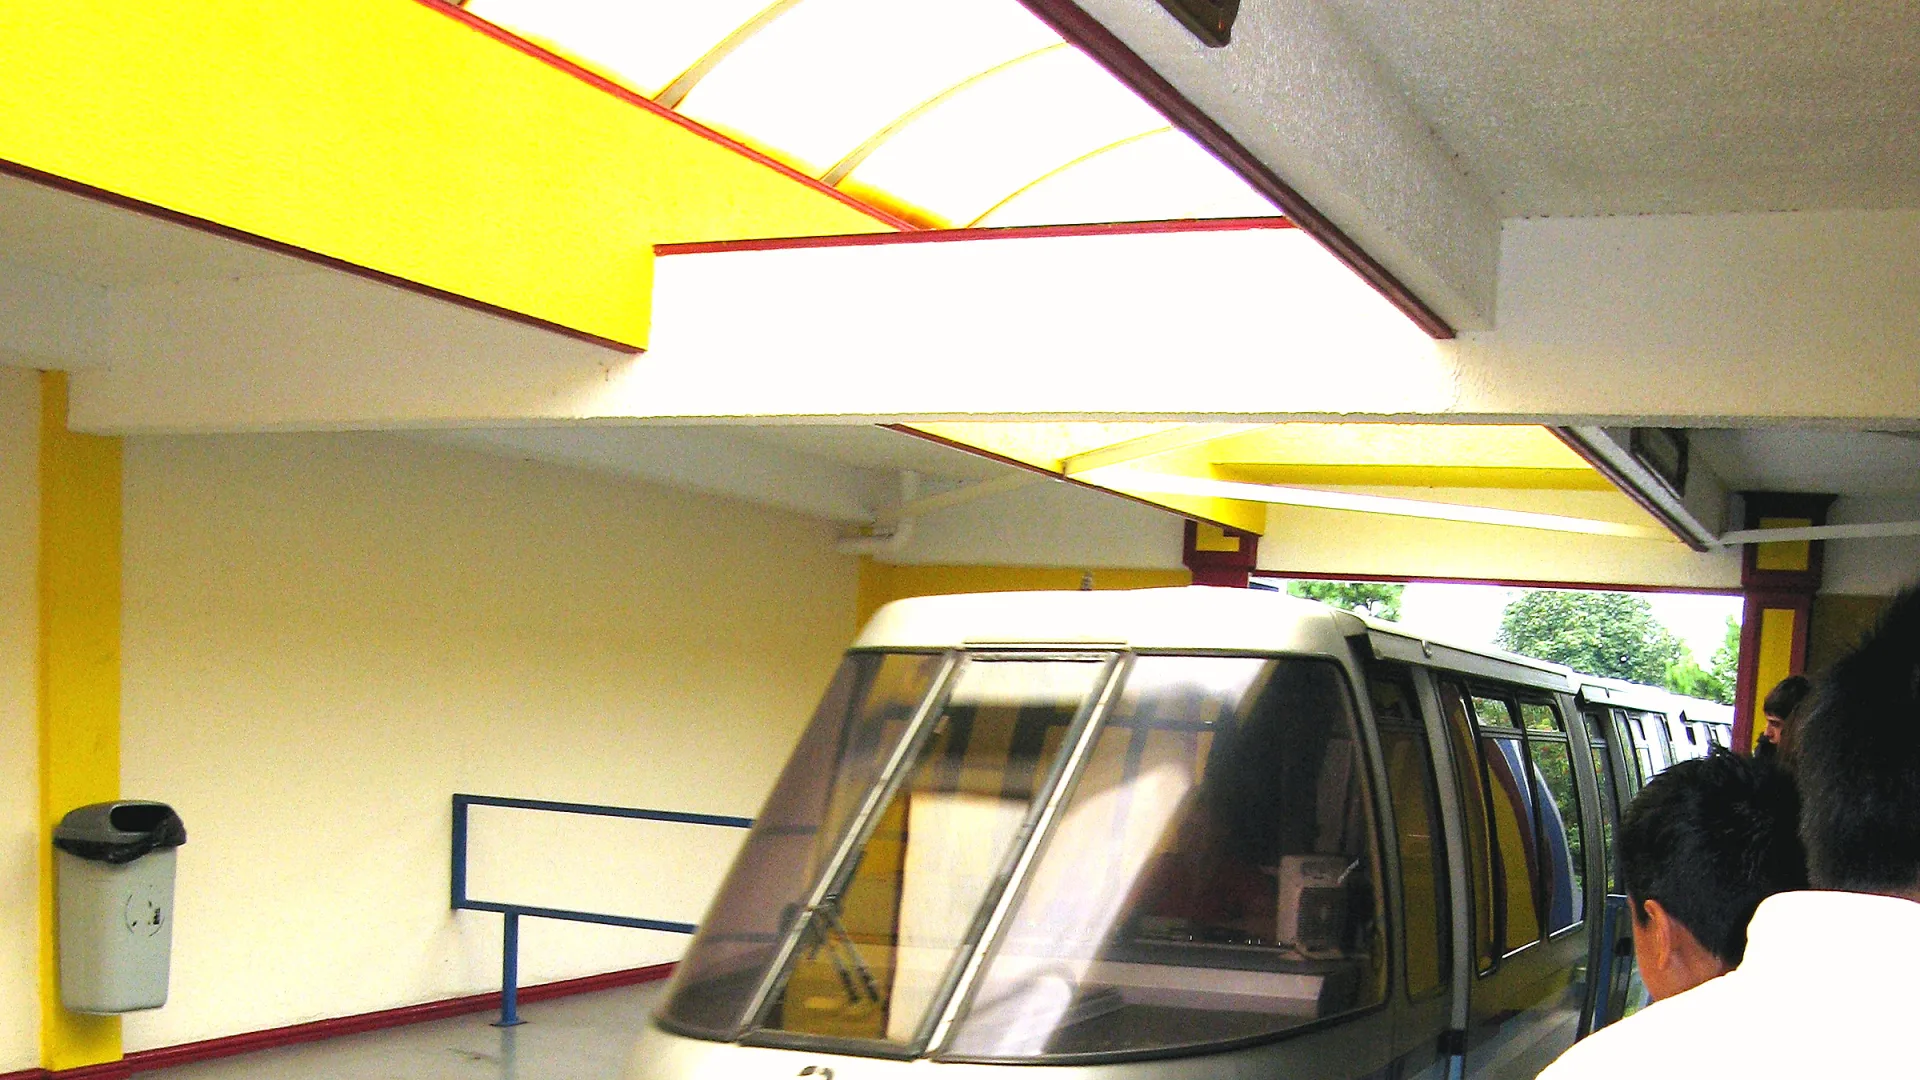
Monorail to Hotels & Car Parks is the return trip from Entrance Plaza to the hotel and parking side of Alton Towers.

This Monorail direction is the last leg of many park days: from Towers Street, the train glides back to the car parks, hotels and resort facilities. It is practical transport, but still a classic piece of the Alton Towers experience thanks to its elevated track, colourful trains and views along the way. The system opened in 1987 after the original Expo 86 stock was moved to the resort.

Normal 5 min
Average 9 min
Highest measurement 45 min Measured at 30-07 18:21
Type Ride
Category Transport
Photos
RCDB

Coaster profile

Classification

Scale low
Ride type Monorail Automated People Mover
Opened August 13, 1987
Rethemed 2008
Cost £15 million (€17.6 million)
Direction Entrance Plaza to Hotels & Car Parks
Sources Alton Towers support; Alton Towers car parking information; TowersTimes; TowersStreet; The Monorail Society; Wikipedia

Tracks

Length 10,498.7 ft (3,200.0 m)
Height 29.5 ft (9.0 m)
Speed 16.8 mph (27.0 km/h)
Ride duration 4:00

Trains

Arrangement 8 Monorail-treinen; per trein kunnen maximaal 96 passagiers mee.
Trains 8
Riders per train 96
Capacity per hour 4,800

Location

This direction runs from Entrance Plaza at Towers Street to the station between the car parks and resort hotels.

Notes

TowersTimes lists V.R.H / Allot & Lomax / C.W.A, Monorail Automated People Mover, an opening on 13 August 1987, a 2.0-mile length, a maximum height of 29.5 ft, 8 trains, 96 passengers per train, 4,800 riders per hour and a ride time of 4 minutes. The return direction from Towers Street follows virtually the same double route in reverse towards the car parks and hotel side.

Theming

Each train has its own colour scheme and theme treatment, so even this transport link feels like a recognisable resort ride.

Data

Wait statistics

Based on available measurements and historical wait-time data.

Now Closed
Normal 5 min
Average 9 min
Highest measurement 45 min Measured at 30-07 18:21
Measurements 1523
Outage measurements 0
Avg. outage duration -
Often busy 17:00 15 min average
Often quiet 09:00 5 min average
Reliability High 1370 measurements, 9 hour blocks
Distribution

Boxplots

Spread of wait times, outage duration, and the number of outages per day based on available historical data.

Wait times

1523 measurements

0 min 15 min 30 min 45 min
Min
5 min
Q1
5 min
Median
5 min
Q3
5 min
Max
45 min

Typical wait time: around 5 min.

It usually falls between 5 min and 5 min.

See more than 5 min? It is probably busier than usual — consider a quieter moment.

Less than 5 min? You are in luck: that does not happen often.

Outage duration

Not enough data yet for a boxplot.

This attraction has not reported any outages to us yet. We cannot say anything meaningful about it here.

Outages per day

Not enough data yet for a boxplot.

This attraction has not reported any outages to us yet. We cannot say anything meaningful about it here.

Historical

Wait-time build-up

Today compared with historical wait times by hour.

Today Expected Historical
Horizontal axis hours, vertical axis queue minutes. 0 min 5 min 10 min 15 min 20 min 10:00 11:00 12:00 13:00 14:00 15:00 16:00 17:00 18:00