

← Back to Walibi Belgium
Ride details

FLASH-BACK

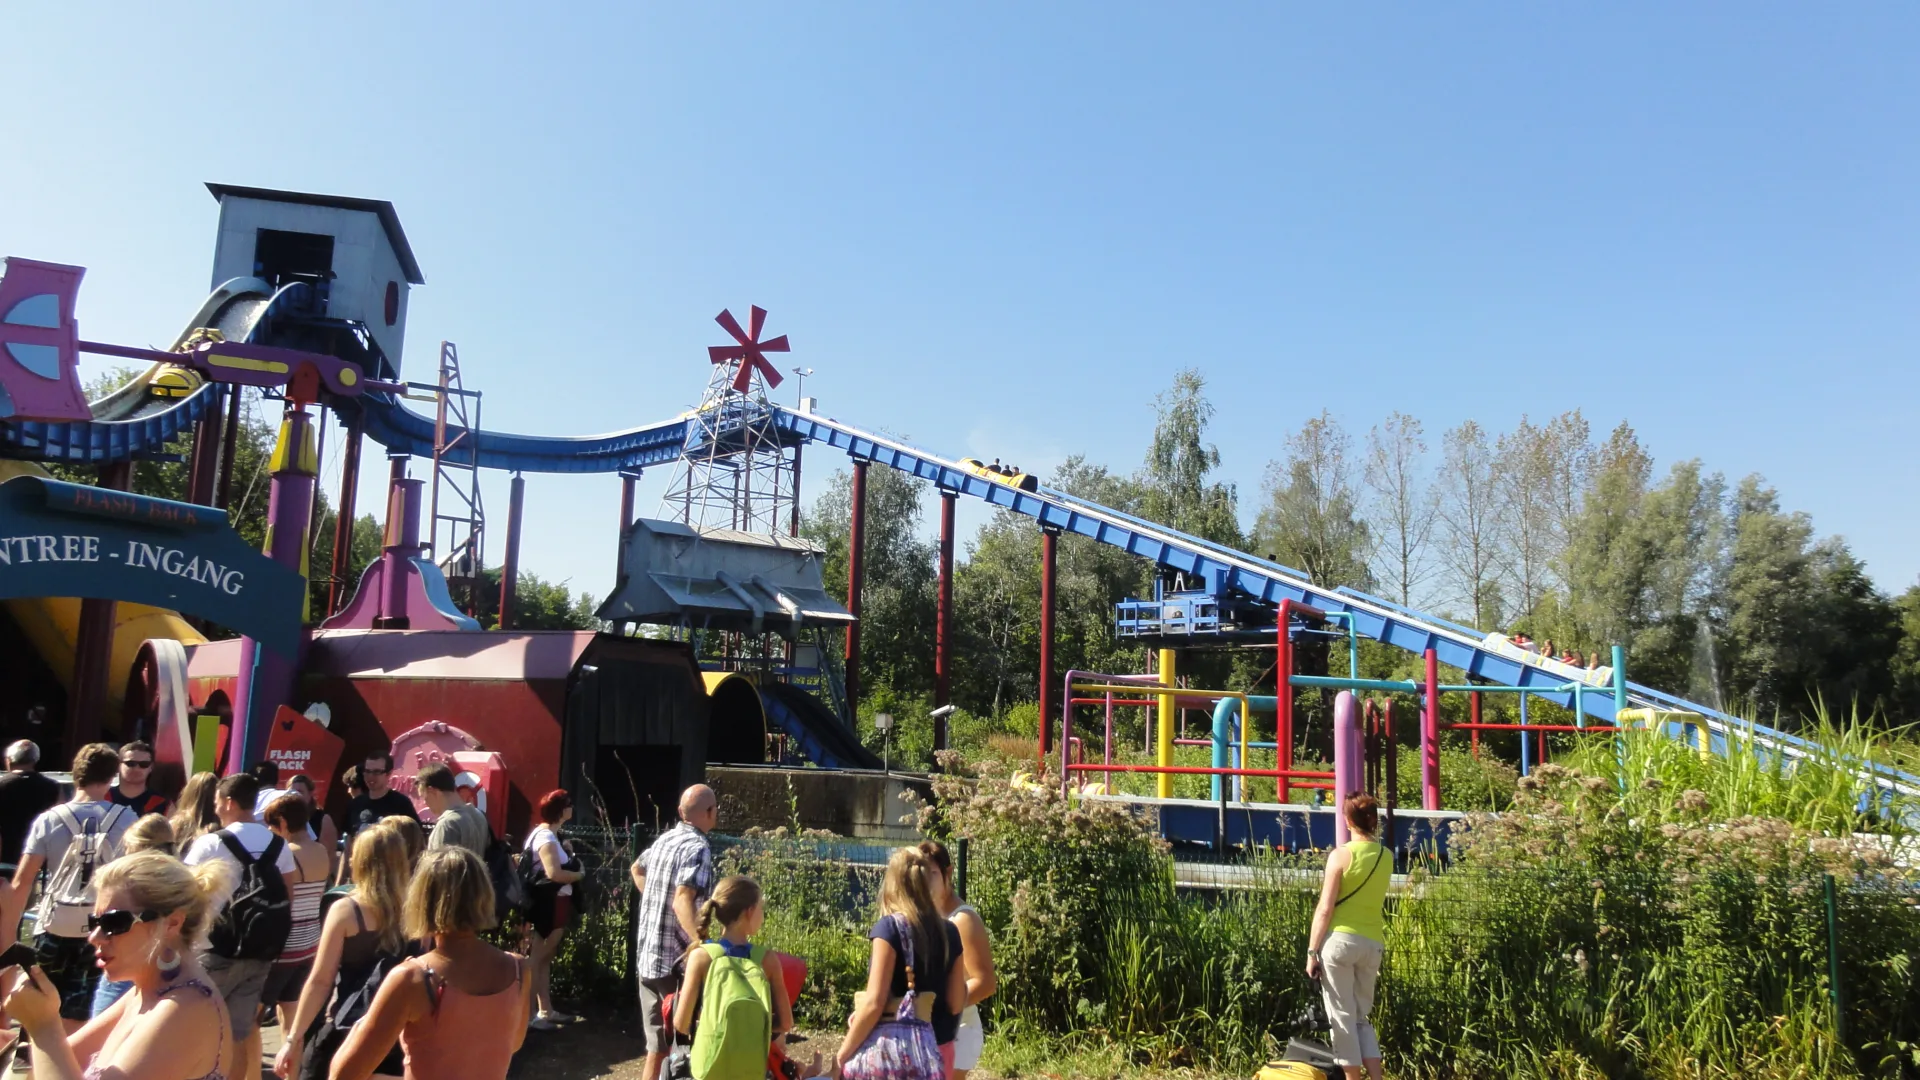
Flash-Back is een Mack log flume in Dock World met achterwaartse drop en dubbele splash.

Flash-Back gebruikt het klassieke boomstamvaart-recept, maar geeft er een eigen draai aan met steile stukken, onverwachte bochten en een achterwaartse passage voor de finale splash. Het resultaat is familievriendelijk, maar net onvoorspelbaar genoeg om spannend te blijven.

Normal 5 min
Average 9 min
Highest measurement 45 min Measured at 29-06 15:53
Type Ride
Category Log flume
Photos
RCDB

Coaster profile

Classification

Scale family_thrill

Location

Dock World

Notes

Officiële Walibi-pagina noemt steile klimmen, onverwachte wendingen, een achterwaartse drop en een dubbele splash. Wikipedia vermeldt 1995 als openingsjaar en Mack Rides als fabrikant.

Theming

Tijdreis-waterattractie met een achterwaartse afdaling en dubbele splash, waardoor de rit meer verrassing heeft dan een gewone boomstamvaart.

Data

Wait statistics

Based on available measurements and historical wait-time data.

Now 5 min
Normal 5 min
Average 9 min
Highest measurement 45 min Measured at 29-06 15:53
Measurements 3843
Outage measurements 411
Avg. outage duration 24 min
Often busy 13:00 10 min average
Often quiet 10:00 5 min average
Reliability High 4096 measurements, 9 hour blocks
Distribution

Boxplots

Spread of wait times, outage duration, and the number of outages per day based on available historical data.

Wait times

3843 measurements

0 min 15 min 30 min 45 min
Min
5 min
Q1
5 min
Median
5 min
Q3
10 min
Max
45 min

Typical wait time: around 5 min.

It usually falls between 5 min and 10 min.

See more than 10 min? It is probably busier than usual — consider a quieter moment.

Less than 5 min? You are in luck: that does not happen often.

Outage duration

94 outages

0 min 30 min 60 min 90 min 120 min
Min
5 min
Q1
5 min
Median
6 min
Q3
20 min
Max
119 min

Outages usually last about 6 min.

Some are over quickly (sometimes within 5 min), others take longer (up to 20 min). That varies per outage.

Already longer than 20 min? The attraction may stay closed a while longer.

Outages per day

37 days

0 2 4 6
Min
1
Q1
2
Median
2
Q3
4
Max
6

On days with outages, we see an average of 2 per day.

That usually falls between 2 and 4.

On quiet days it was 1, on busy days up to 6.

Historical

Wait-time build-up

Today compared with historical wait times by hour.

Today Expected Historical
Horizontal axis hours, vertical axis queue minutes. 0 min 5 min 10 min 15 min 20 min 10:00 12:00 14:00 16:00 18:00 19:00