

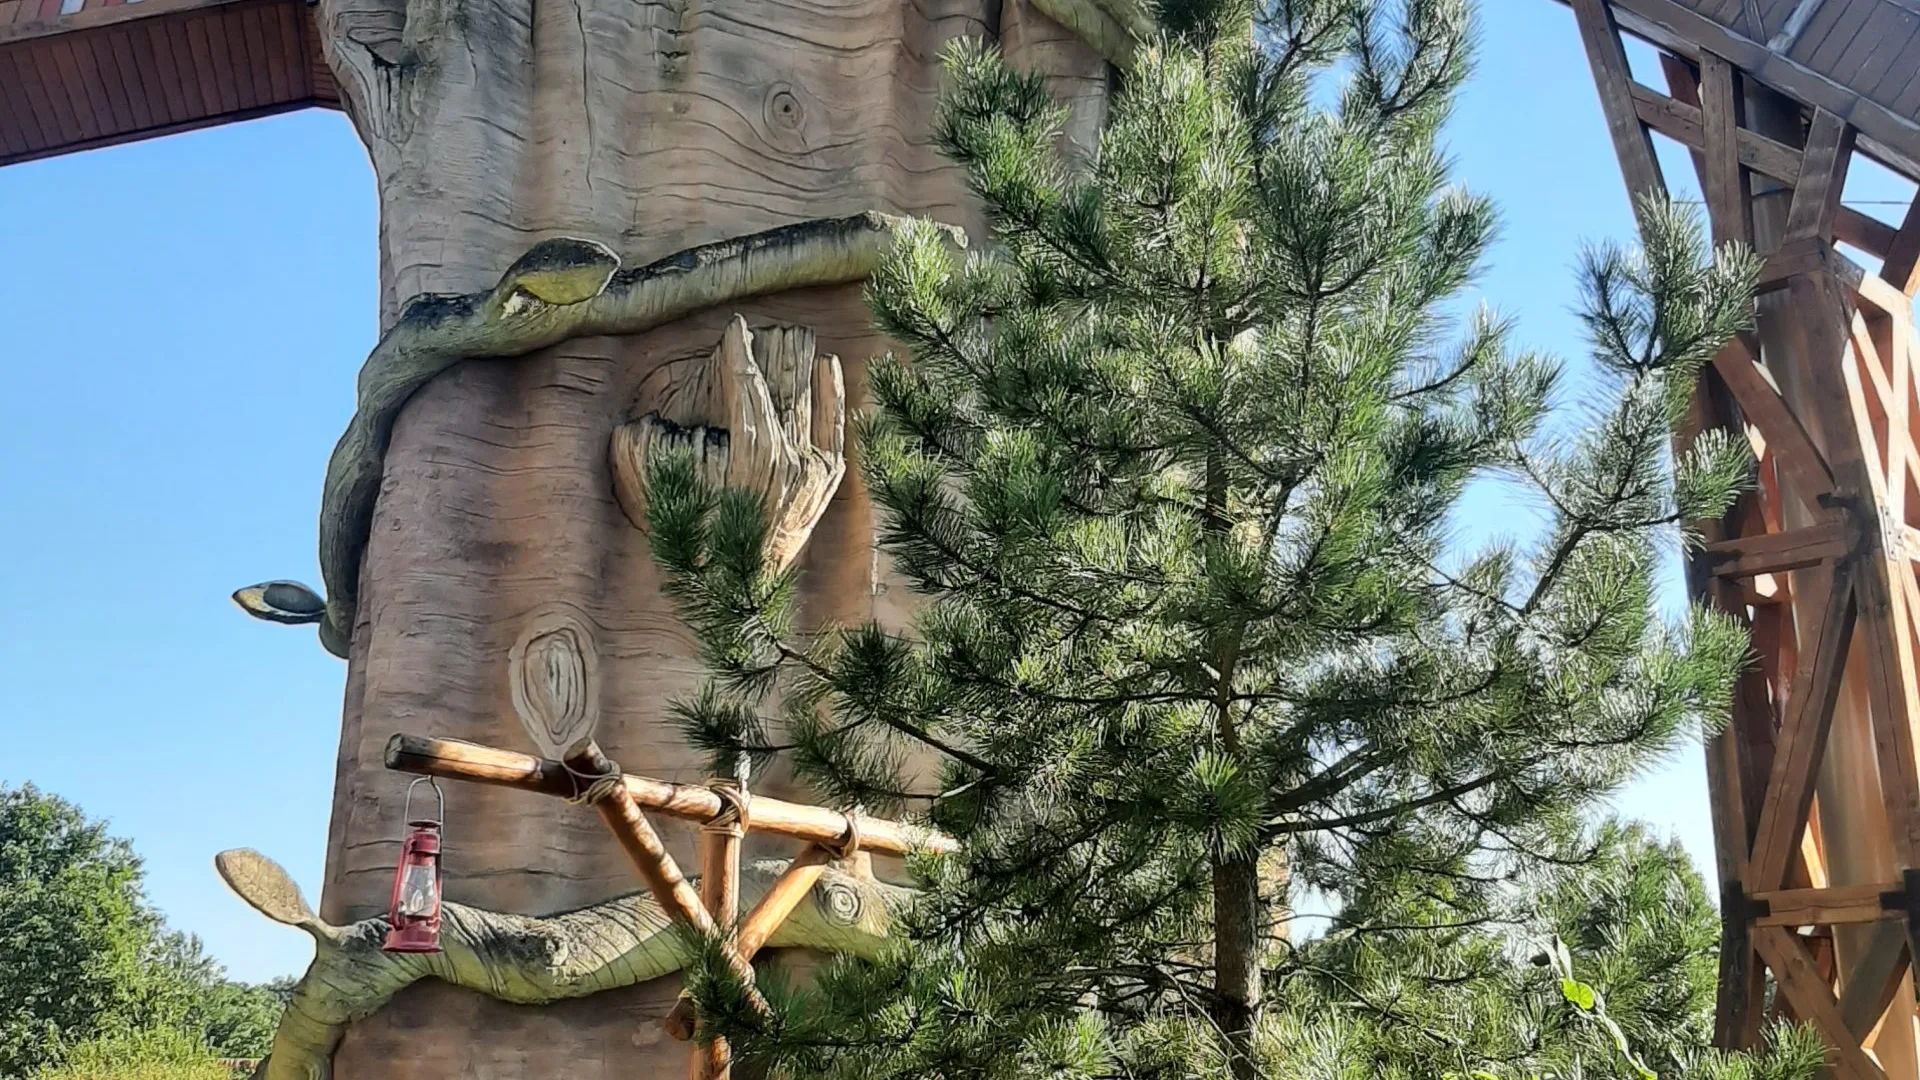
Photo 1 of Expedition Zork
← Back to Toverland Toverland park info Opening hours Toverland
Ride details

Expedition Zork

Expedition Zork is de log flume van Wunderwald, met 398 meter baan, twee drops en een grote splash.

Expedition Zork stuurt bezoekers in boomstamboten door het verhaal van uitvinder Maximus Muller en het mysterieuze wezen Zork. De rit combineert indoor decor, water, liften en afdalingen tot een familierit waarin het verhaal sinds de vernieuwing van 2022 sterker in Wunderwald is verweven.

Normal 5 min
Average 20 min
Highest measurement 70 min Measured at 06-08 15:22
Type Ride
Category Log flume
Photos
RCDB

Coaster profile

Classification

Scale family
Attractietype Log Flume
Hoeveelheid Water 4.000.000 L
Aantal Voertuigen 11
Aantal Drops 2
Vernieuwd 2022
Minimumlengte Zelfstandig 120 cm
Bronnen Toverland officiele attractiepagina; Coasterpedia Expedition Zork; InPark Magazine Zork update

Tracks

Length 1,305.8 ft (398.0 m)
Height 59.1 ft (18.0 m)
Drop 49.2 ft (15.0 m)
Ride duration 4:15

Trains

Arrangement 11 log boats. Coasterpedia lists 6 riders per boat.
Trains 11
Riders per train 6
Capacity per hour 1,250

Elements

Location

Expedition Zork ligt indoor in Wunderwald.

Notes

Toverland vermeldt Mack Rides, 4.000.000 liter water, 18 meter hoogte, 11 voertuigen, 2 drops, 398 meter lengte, 255 seconden ritduur en bouwjaar 2004 met vernieuwing in 2022. Coasterpedia noemt 3 juli 2004 als openingsdatum en 6 rijders per boot.

Theming

De huidige verhaallaag verbindt Maximus Muller, het alpine Wunderwald en het raadsel rond Zork tot een familie-expeditie per boomstamboot.

Data

Wait statistics

Based on available measurements and historical wait-time data.

Now 5 min
Normal 5 min
Average 20 min
Highest measurement 70 min Measured at 06-08 15:22
Measurements 1738
Outage measurements 89
Avg. outage duration 41 min
Often busy 00:00 40 min average
Often quiet 09:00 3 min average
Reliability High 13361 measurements, 24 hour blocks
Distribution

Boxplots

Spread of wait times, outage duration, and the number of outages per day based on available historical data.

Wait times

1738 measurements

0 min 20 min 40 min 60 min 80 min
Min
0 min
Q1
10 min
Median
20 min
Q3
25 min
Max
70 min

Typical wait time: around 20 min.

It usually falls between 10 min and 25 min.

See more than 25 min? It is probably busier than usual — consider a quieter moment.

Less than 10 min? You are in luck: that does not happen often.

Outage duration

159 outages

0 min 25 min 50 min 75 min 100 min
Min
1 min
Q1
5 min
Median
6 min
Q3
21 min
Max
98 min

Outages usually last about 6 min.

Some are over quickly (sometimes within 5 min), others take longer (up to 21 min). That varies per outage.

Already longer than 21 min? The attraction may stay closed a while longer.

Outages per day

68 days

0 2 4 6
Min
1
Q1
2
Median
2
Q3
2
Max
6

On days with outages, we see an average of 2 per day.

That usually falls between 2 and 2.

On quiet days it was 1, on busy days up to 6.

Historical

Wait-time build-up

Today compared with historical wait times by hour.

Today Expected Historical
Horizontal axis hours, vertical axis queue minutes. 0 min 10 min 20 min 30 min 40 min 10:00 11:00 12:00 13:00 14:00 15:00 16:00 17:00 18:00