

← Back to Thorpe Park
Ride details

Vortex

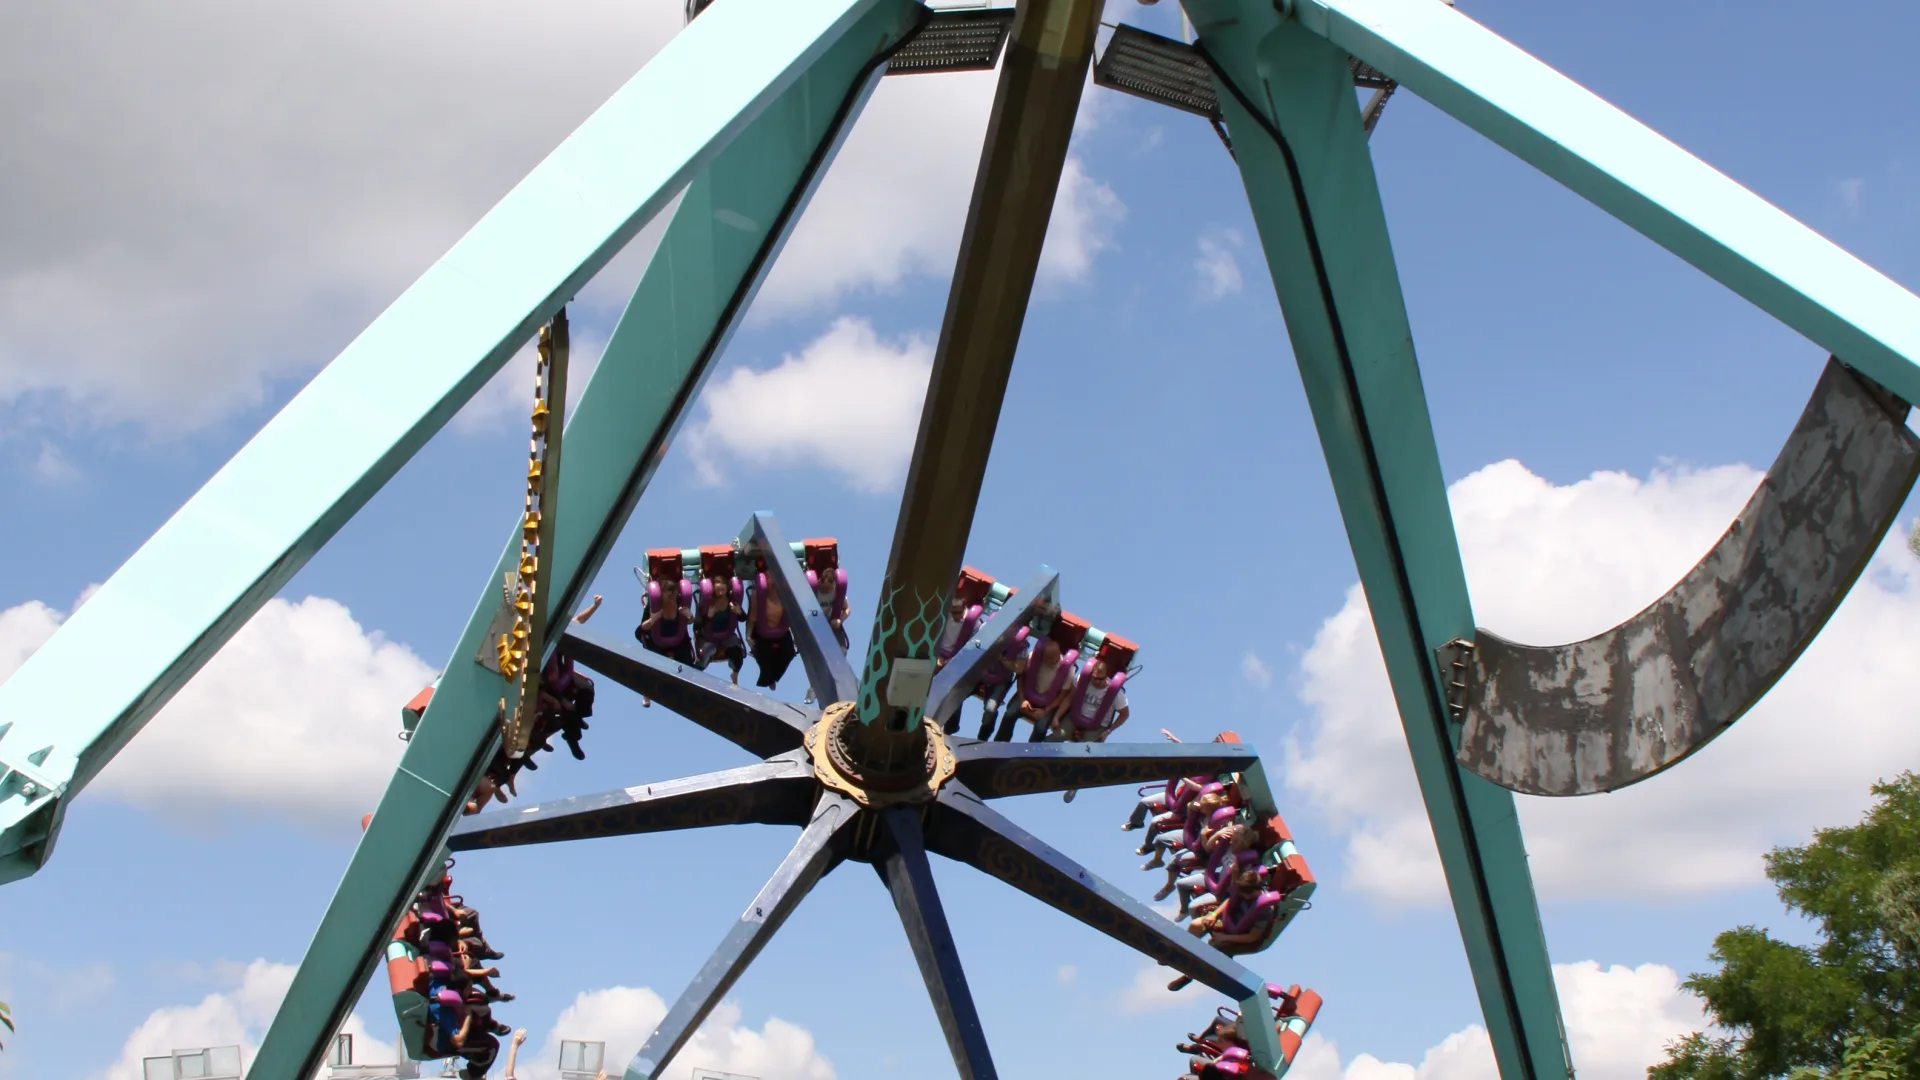
KMG Afterburner in Lost City die riders met 15 rotaties per minuut tot 65 ft door de lucht slingert.

Vortex combineert twee bewegingen die elkaar blijven versterken: de arm slingert hoog heen en weer, terwijl de zitcirkel blijft roteren. Daardoor wisselen uitzicht, richting en kracht voortdurend. Het is geen lange rit, maar wel een compacte Lost City-thrill waarin hoogte, draaien en pendelen tegelijk binnenkomen.

Normal 11 min
Average 16 min
Highest measurement 45 min Measured at 22-06 15:04
Type Ride
Category Spinning Ride
Photos
RCDB

Coaster profile

Classification

Scale high
Official type Swinging pendulum / Afterburner
Park area Lost City
Opened May 25, 2001
Manufacturer KMG
Ride model Afterburner
Official swinging height 65.0 ft (19.8 m) / 65.0 ft (19.8 m)
Rotations 15 rotations per minute
Swing angle About 120 degrees
Vehicles 8 gondolas
Riders per vehicle 4
Capacity 450 riders per hour
Minimum height 4.6 ft (1.4 m)
Maximum torso restriction 51 inches
Accessibility Not suitable for non-ambulant riders due to evacuation procedure
Limb requirement Minimum of 3 full limbs; amputations below elbow or knee
Fastrack Available

Tracks

Height 65.0 ft (19.8 m)

Notes

Officiele Thorpe Park-bron: Vortex draait 15 keer per minuut, slingert tot 65 ft, heeft Fastrack, 1,40 m minimumlengte en 51 inch maximale torso-restrictie. Wikipedia vermeldt opening op 25 mei 2001, KMG Afterburner, 8 gondels met 4 riders per gondel en circa 450 personen per uur.

Theming

Vortex past bij Lost City als mechanische storm: een pendel die niet alleen zwaait, maar ook voortdurend om zijn eigen middelpunt draait.

Data

Wait statistics

Based on available measurements and historical wait-time data.

Now Closed
Normal 11 min
Average 16 min
Highest measurement 45 min Measured at 22-06 15:04
Measurements 298
Outage measurements 0
Avg. outage duration -
Often busy 12:00 20 min average
Often quiet 10:00 5 min average
Reliability High 357 measurements, 8 hour blocks
Distribution

Boxplots

Spread of wait times, outage duration, and the number of outages per day based on available historical data.

Wait times

298 measurements

0 min 15 min 30 min 45 min
Min
5 min
Q1
5 min
Median
15 min
Q3
25 min
Max
45 min

Typical wait time: around 15 min.

It usually falls between 5 min and 25 min.

See more than 25 min? It is probably busier than usual — consider a quieter moment.

Less than 5 min? You are in luck: that does not happen often.

Outage duration

Not enough data yet for a boxplot.

This attraction has not reported any outages to us yet. We cannot say anything meaningful about it here.

Outages per day

Not enough data yet for a boxplot.

This attraction has not reported any outages to us yet. We cannot say anything meaningful about it here.

Historical

Wait-time build-up

Today compared with historical wait times by hour.

Today Expected Historical
Horizontal axis hours, vertical axis queue minutes. 0 min 5 min 10 min 15 min 20 min 10:00 12:00 14:00 16:00 18:00 19:00