

← Back to Thorpe Park
Ride details

Tidal Wave

Grote Hopkins Shoot the Chute in Amity Cove met een 85 ft drop en een splash die ook omstanders raakt.

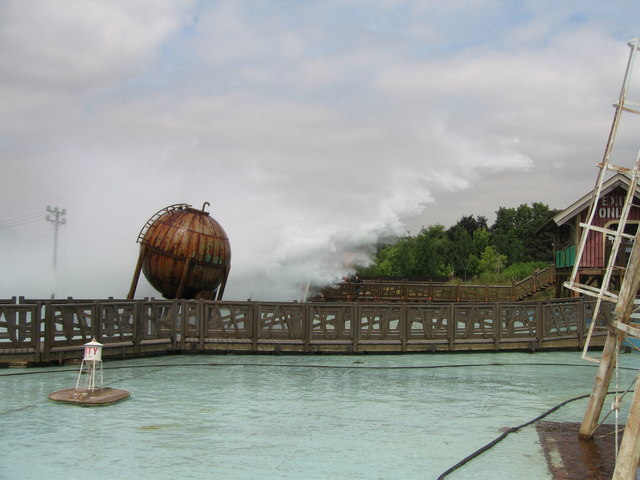
Tidal Wave is Thorpe Parks klassieke nat-word-garantie. De oversized boot klimt omhoog boven Amity Cove, valt vanaf 85 ft terug naar het water en maakt een golf die net zo belangrijk is voor de kijkers op de kant als voor de riders zelf. De rit is kort, maar de impact is groot: water, lawaai en een dorp dat lijkt te zijn geraakt door een rampgolf.

Normal 35 min
Average 39 min
Highest measurement 150 min Measured at 13-07 14:33
Type Ride
Category Log flume
Photos
RCDB

Coaster profile

Classification

Scale thrill
Official type Shoot the Chute water ride
Park area Amity Cove
Opened April 7, 2000
Manufacturer Hopkins Rides
Ride model Shoot the Chute
Official height 85.0 ft (25.9 m) / 85.0 ft (25.9 m)
Drop 85.2 ft (26.0 m)
Official top speed 45.0 mph (72.4 km/h) / 45.0 mi (72.4 km)/h
Duration About 2 minutes 30 seconds
Boats 3
Seating 5 rows per boat, 4 riders per row
Minimum height 3.9 ft (1.2 m)
Splash force 88000 N water wave
Water per rider 215 litres
Accessibility Suitable for non-ambulant riders who can transfer with assistance; evacuation chair present for lift descent
Limb requirement Minimum of 3 full limbs; missing or amputated legs below knee
Fastrack Available

Tracks

Height 85.0 ft (25.9 m)
Speed 45.0 mph (72.4 km/h)
Ride duration 2:30

Notes

Officiele Thorpe Park-bron: Tidal Wave is een Shoot the Chute met 85 ft hoogte, 45 mph topsnelheid, 1,20 m minimumlengte, 88.000 N splashkracht en circa 215 liter water per rider. Wikipedia vermeldt opening op 7 april 2000, Hopkins Rides, 85,2 ft drop, 3 boten en circa 2:30 ritduur.

Theming

Tidal Wave speelt in Amity Cove, een rampzalige kustplaats waar de volgende watermassa elk moment door de straat kan slaan.

Data

Wait statistics

Based on available measurements and historical wait-time data.

Now Closed
Normal 35 min
Average 39 min
Highest measurement 150 min Measured at 13-07 14:33
Measurements 1198
Outage measurements 0
Avg. outage duration -
Often busy 14:00 53 min average
Often quiet 10:00 5 min average
Reliability High 1287 measurements, 8 hour blocks
Distribution

Boxplots

Spread of wait times, outage duration, and the number of outages per day based on available historical data.

Wait times

1198 measurements

0 min 40 min 80 min 120 min 160 min
Min
5 min
Q1
20 min
Median
35 min
Q3
50 min
Max
150 min

Typical wait time: around 35 min.

It usually falls between 20 min and 50 min.

See more than 50 min? It is probably busier than usual — consider a quieter moment.

Less than 20 min? You are in luck: that does not happen often.

Outage duration

Not enough data yet for a boxplot.

This attraction has not reported any outages to us yet. We cannot say anything meaningful about it here.

Outages per day

Not enough data yet for a boxplot.

This attraction has not reported any outages to us yet. We cannot say anything meaningful about it here.

Historical

Wait-time build-up

Today compared with historical wait times by hour.

Today Expected Historical
Horizontal axis hours, vertical axis queue minutes. 0 min 15 min 30 min 45 min 60 min 10:00 12:00 14:00 16:00 18:00 19:00