

← Back to Thorpe Park
Ride details

Rush

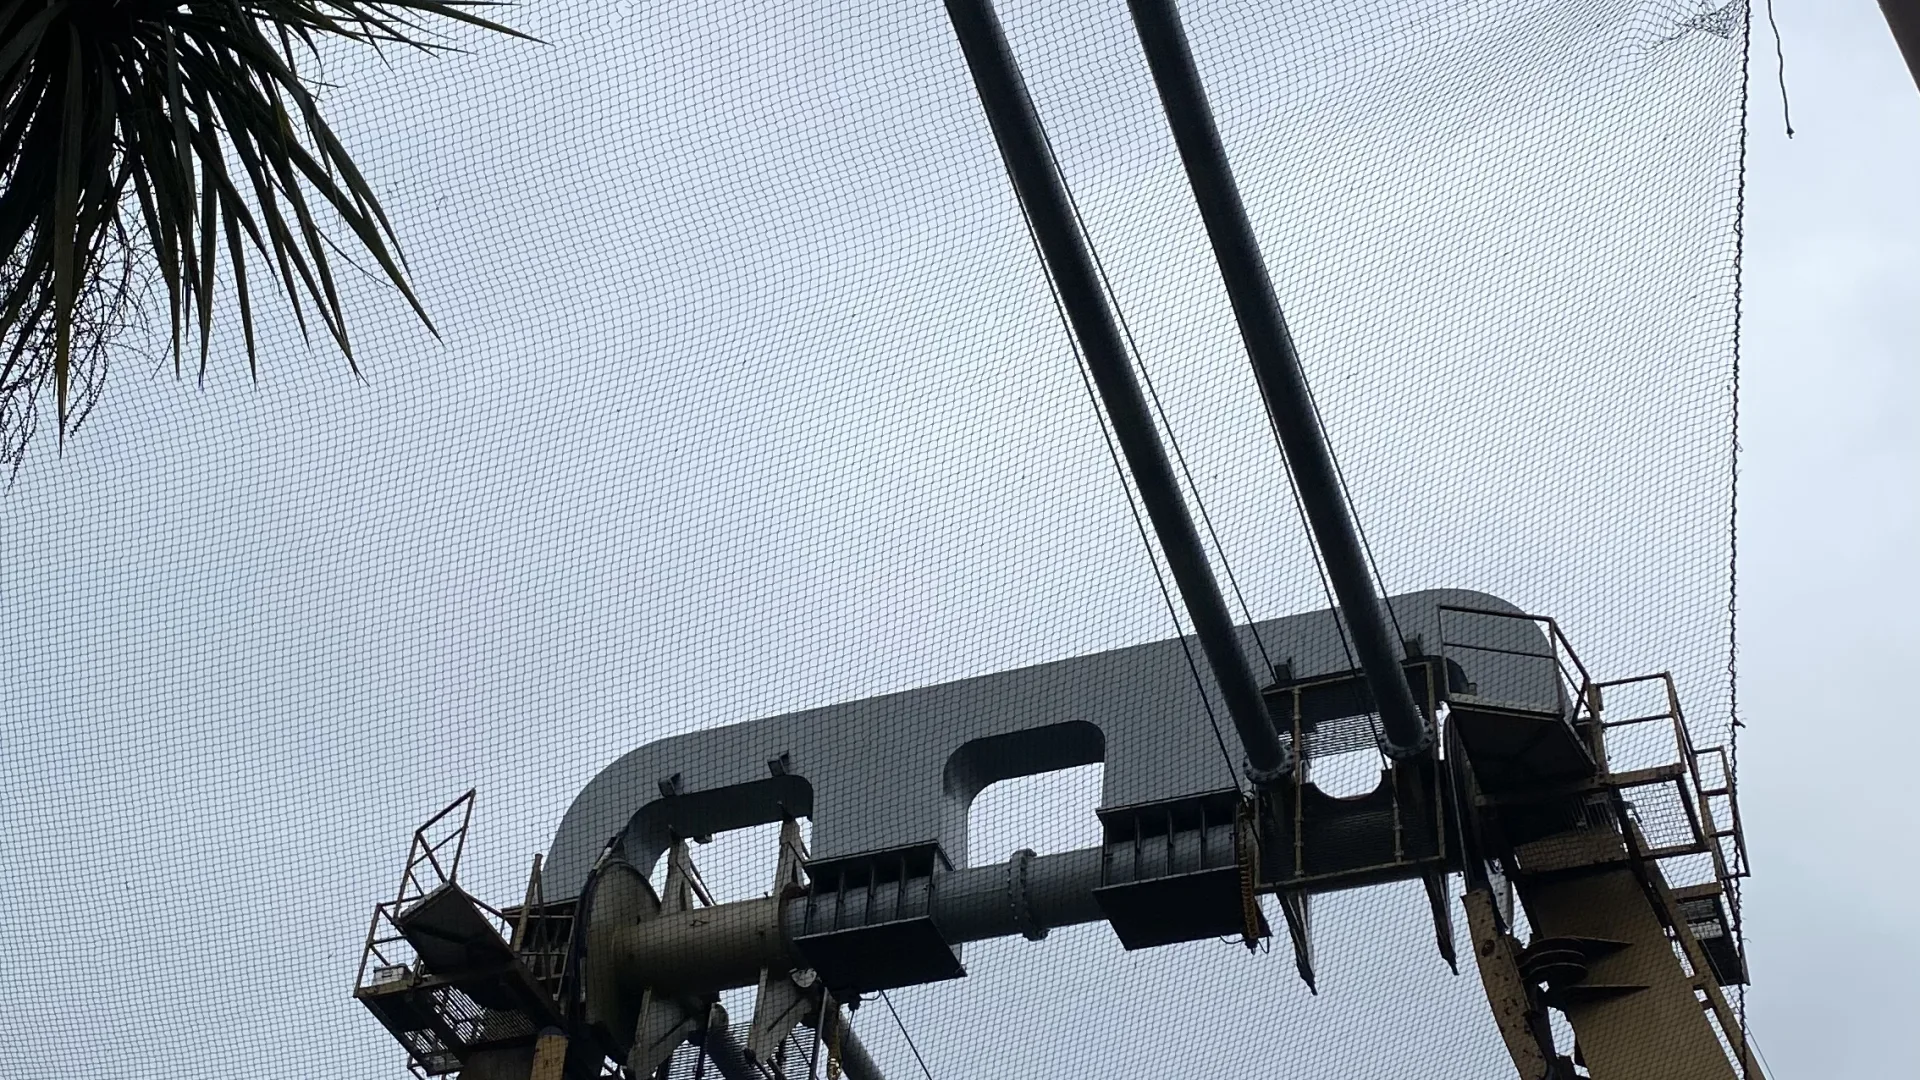
Air-powered S&S Screamin Swing in Lost City die tot 75 ft hoog en 50 mph door zijn slingerboog gaat.

Rush is een van Thorpe Parks meest openlijke airtime-machines: twee armen zwiepen riders steeds hoger tot de slingerbeweging meer op vliegen dan schommelen lijkt. De combinatie van luchtdruk, hoogtegevoel en snelle terugduik maakt de rit kort maar intens, met Lost City als decor voor een brede pendelbeweging boven het plein.

Normal 25 min
Average 27 min
Highest measurement 80 min Measured at 29-06 12:48
Type Ride
Category Swing Ride
Photos
RCDB

Coaster profile

Classification

Scale high
Official type Air-powered Screamin Swing
Park area Lost City
Opened May 27, 2005
Manufacturer S&S - Sansei Technologies
Ride model Screamin Swing
Official swinging height 75.0 ft (22.9 m) / 75.0 ft (22.9 m)
Wikipedia structural height 105.0 ft (32.0 m)
Official swinging speed 50.0 mph (80.5 km/h) / 50.0 mi (80.5 km)/h
Wikipedia speed 45.0 mph (72.4 km/h)
G-force Up to 4 G
Minimum height 4.3 ft (1.3 m)
Vehicles 2
Riders per vehicle 16
Duration About 1 minute
Capacity 768 riders per hour
Accessibility Suitable for non-ambulant riders who can transfer with assistance and brace with full upper-body control
Limb requirement Minimum of 3 full limbs; prosthetics secured or removed

Tracks

Height 75.0 ft (22.9 m)
Speed 50.0 mph (80.5 km/h)

Notes

Thorpe Park vermeldt 75 ft slingerhoogte, 50 mph slingersnelheid, Fastrack en tot 4G. Wikipedia vermeldt opening op 27 mei 2005, S&S - Sansei Technologies, Screamin Swing, twee voertuigen met 16 riders per voertuig, circa 1 minuut ritduur en 768 personen per uur.

Theming

Rush past in Lost City als grote openluchtpendel: geen lange verhaallijn, maar een zichtbaar ritueel van snelheid, lucht en hoogte.

Data

Wait statistics

Based on available measurements and historical wait-time data.

Now Closed
Normal 25 min
Average 27 min
Highest measurement 80 min Measured at 29-06 12:48
Measurements 1260
Outage measurements 0
Avg. outage duration -
Often busy 12:00 35 min average
Often quiet 10:00 10 min average
Reliability High 1390 measurements, 8 hour blocks
Distribution

Boxplots

Spread of wait times, outage duration, and the number of outages per day based on available historical data.

Wait times

1260 measurements

0 min 20 min 40 min 60 min 80 min
Min
5 min
Q1
15 min
Median
25 min
Q3
35 min
Max
80 min

Typical wait time: around 25 min.

It usually falls between 15 min and 35 min.

See more than 35 min? It is probably busier than usual — consider a quieter moment.

Less than 15 min? You are in luck: that does not happen often.

Outage duration

Not enough data yet for a boxplot.

This attraction has not reported any outages to us yet. We cannot say anything meaningful about it here.

Outages per day

Not enough data yet for a boxplot.

This attraction has not reported any outages to us yet. We cannot say anything meaningful about it here.

Historical

Wait-time build-up

Today compared with historical wait times by hour.

Today Expected Historical
Horizontal axis hours, vertical axis queue minutes. 0 min 10 min 20 min 30 min 40 min 10:00 12:00 14:00 16:00 18:00 19:00