

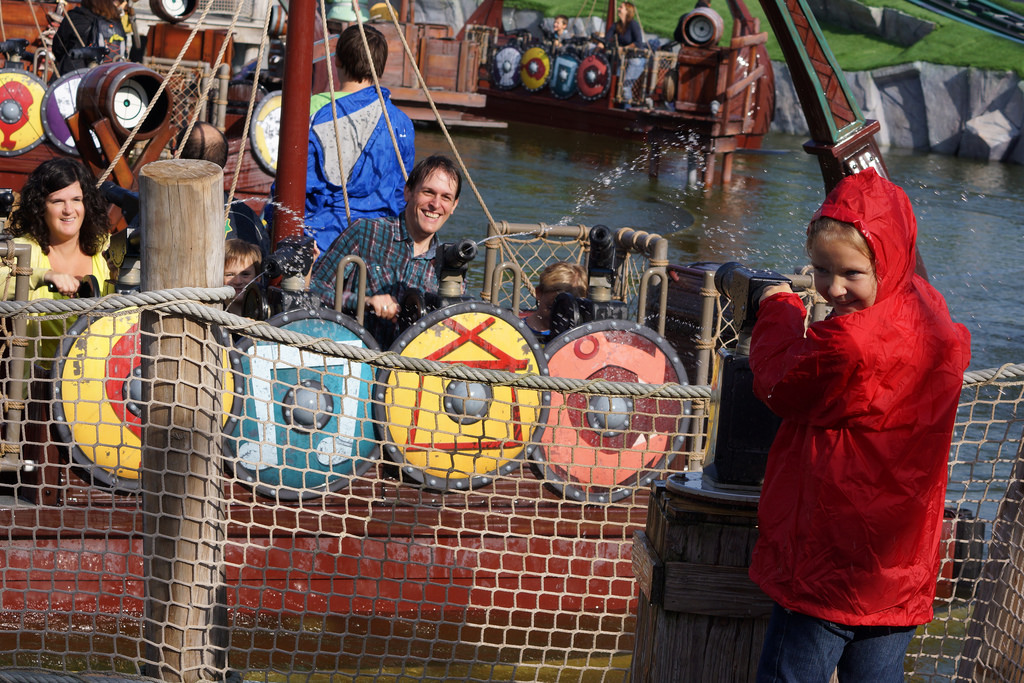
Winter Cold Also Shut Down Wickie The Battle at Plopsaland
On Boxing Day 2025, winter cold kept many outdoor attractions at Plopsaland closed, including Wickie The Battle. The park said it would review whether extra measures were needed to make more rides resistant to cold conditions.
More context
On Boxing Day 2025, Plopsaland showed how vulnerable its outdoor ride offer can be in winter cold. Around freezing point, many outdoor attractions stayed closed, from major roller coasters and water rides to surprisingly simple rides. Wickie The Battle was also listed as unavailable, alongside Anubis, Heidi The Ride, DinoSplash, SuperSplash and The Ride to Happiness. For guests, the situation was especially frustrating because a day ticket cost 51 euros and the park did not offer compensation or a reduced price. Later in the afternoon, several attractions briefly reopened, but some closed again before the end of the day. Plopsaland pointed out that indoor rides, shows, meet-and-greets and a parade were still available, while also acknowledging that it would internally review whether extra measures were needed to make attractions more resistant to cold conditions. For Wickie The Battle, the story fits a wider pattern: the water ride belongs to a park that wants to operate for more of the year, yet winter weather remains a tough test for technology, scheduling and guest expectations.