

← Back to Plopsaland
Ride details

Nachtwacht-Flyer

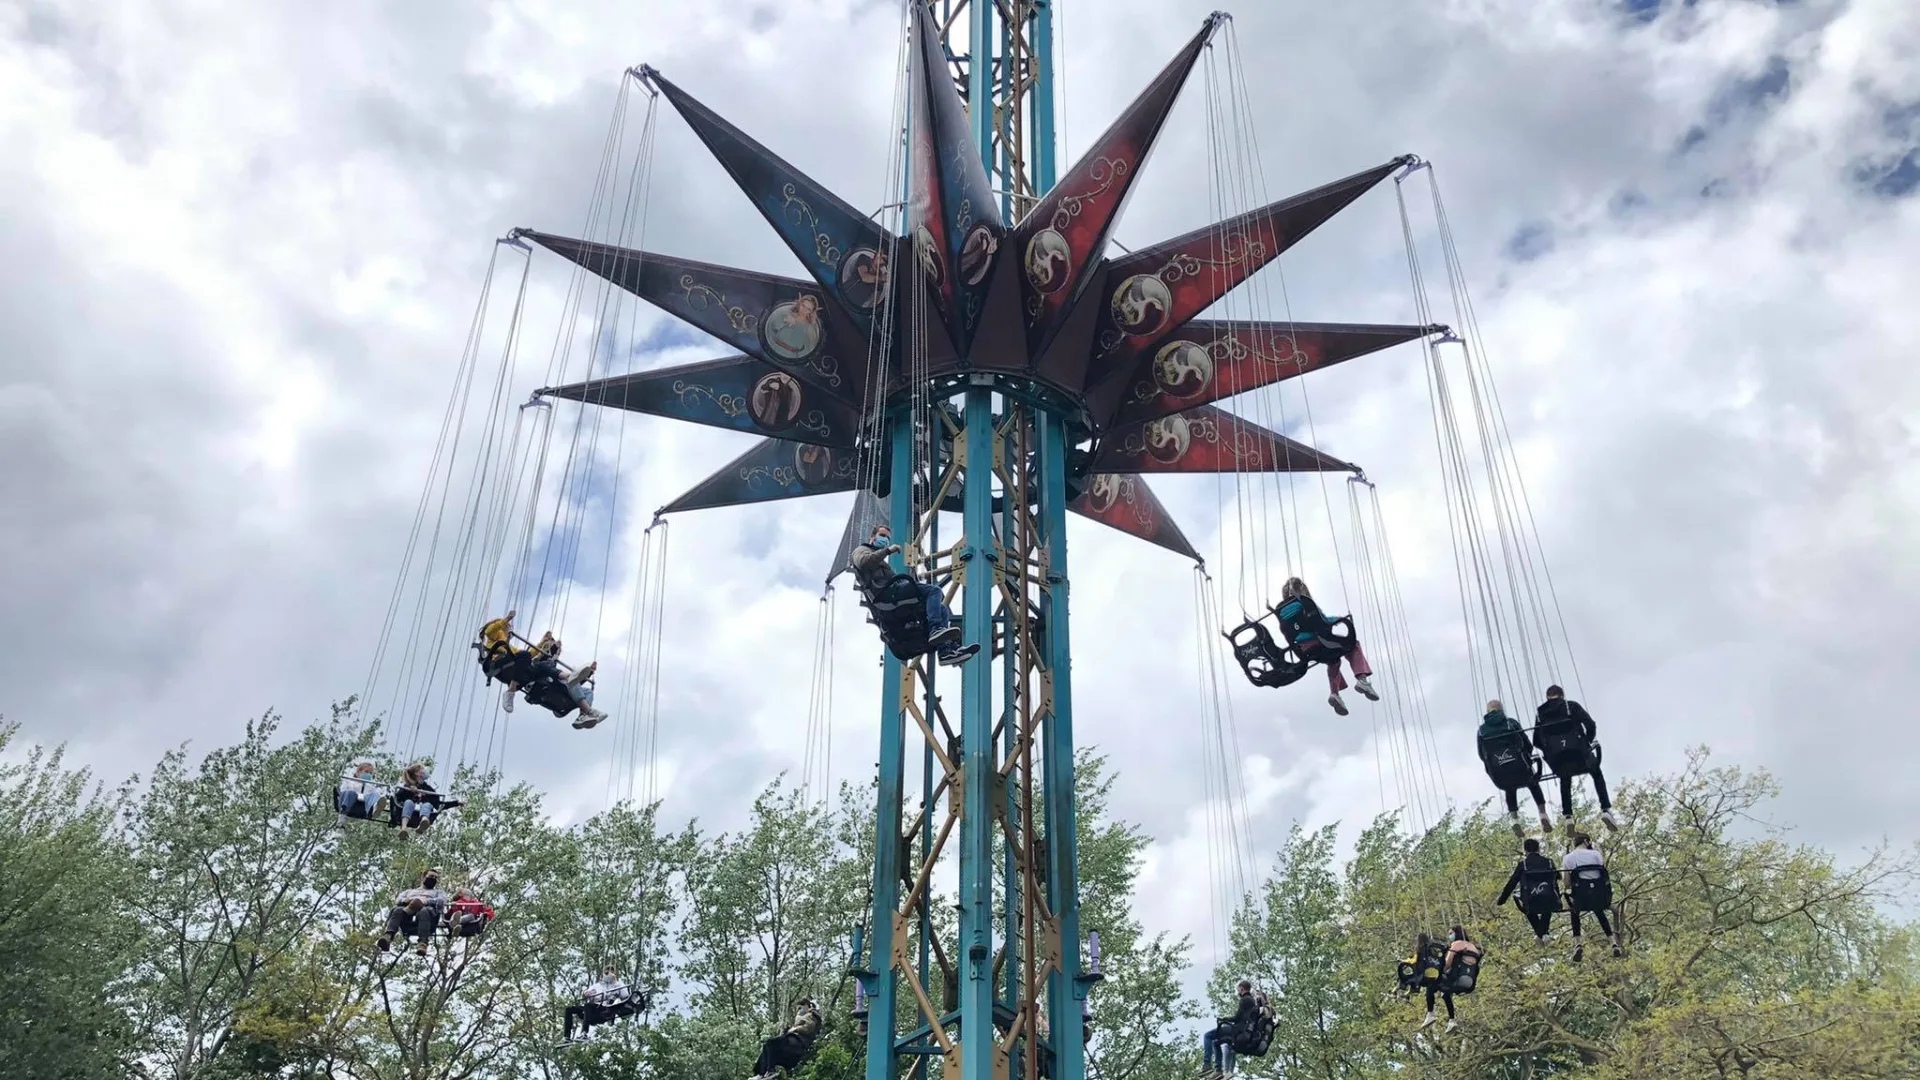
Star Flyer van 67 meter met Nachtwacht-thema en uitzicht over Plopsaland en de kust.

Nachtwacht-Flyer tilt de klassieke zweefmolenrit naar grote hoogte. De stoeltjes draaien ruim boven het park, waardoor de rit minder om scherpe bewegingen draait en meer om hoogte, wind en uitzicht. Daardoor past hij goed bij durfalende families, maar blijft de 67 meter hoge toren een duidelijke thrill.

Normal 0 min
Average 7 min
Highest measurement 35 min Measured at 23-07 15:07
Type Ride
Category Swing Ride
Photos
RCDB

Coaster profile

Classification

Scale thrill
Capaciteit per cyclus 24 passagiers
Minimumlengte zelfstandig 140 cm

Tracks

Height 219.8 ft (67.0 m)
Ride duration 3:00

Notes

De vaste profieldata is bijgewerkt zonder de actuele live-status te overschrijven; de officiële pagina kan tijdelijke sluitingen tonen.

Theming

Nachtwacht-thema; de toren draaide eerder onder de namen Spring-Flyer en ROX-Flyer.

Historie

Geopend op 21 mei 2006 als Spring-Flyer, later omgevormd tot ROX-Flyer en daarna opnieuw gethematiseerd tot Nachtwacht-Flyer.

Data

Wait statistics

Based on available measurements and historical wait-time data.

Now Outage
Normal 0 min
Average 7 min
Highest measurement 35 min Measured at 23-07 15:07
Measurements 3717
Outage measurements 934
Avg. outage duration 67 min
Often busy 14:00 10 min average
Often quiet 10:00 0 min average
Reliability High 3891 measurements, 12 hour blocks
Distribution

Boxplots

Spread of wait times, outage duration, and the number of outages per day based on available historical data.

Wait times

3717 measurements

0 min 10 min 20 min 30 min 40 min
Min
0 min
Q1
0 min
Median
5 min
Q3
10 min
Max
35 min

Typical wait time: around 5 min.

It usually falls between 0 min and 10 min.

See more than 10 min? It is probably busier than usual — consider a quieter moment.

Less than 0 min? You are in luck: that does not happen often.

Outage duration

51 outages

0 min 10 min 20 min 30 min
Min
1 min
Q1
5 min
Median
5 min
Q3
6 min
Max
21 min

On average, an outage lasts about 5 min.

In three out of four cases, the attraction reopens within 6 min.

If it takes longer, expect extra waiting time.

Outages per day

22 days

0 4 8 12 16
Min
1
Q1
2
Median
2
Q3
3
Max
16

On days with outages, we see an average of 2 per day.

That usually falls between 2 and 3.

On quiet days it was 1, on busy days up to 16.

Historical

Wait-time build-up

Today compared with historical wait times by hour.

Today Historical Outage
Horizontal axis hours, vertical axis queue minutes. 0 min 5 min 10 min 15 min 20 min 10:00 12:00 14:00 16:00 18:00 19:00