

← Back to Plopsaland
Ride details

DinoSplash

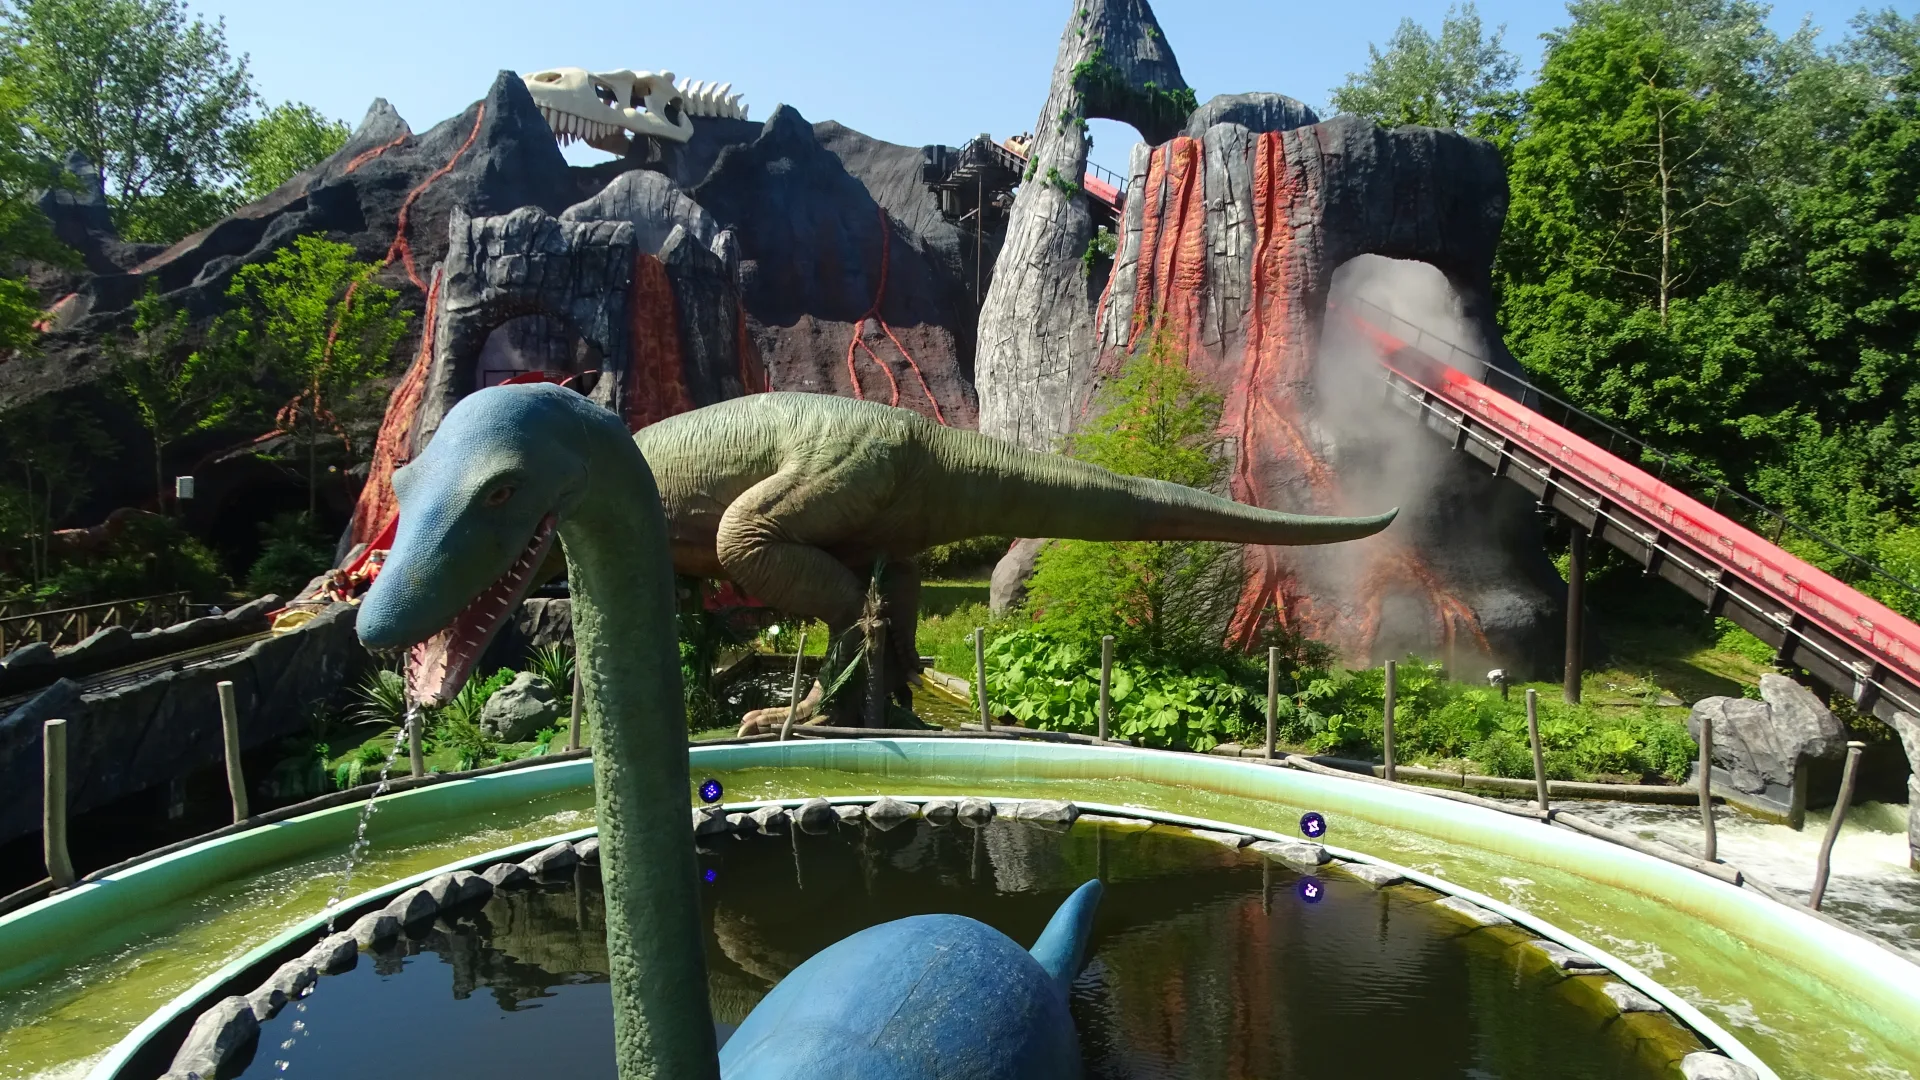
Mack-logflume door een prehistorisch landschap met dinosaurussen, vulkanen en stromend water.

DinoSplash is een klassieker van Plopsaland met een modern dinosaurusthema. De boten varen door een prehistorisch gebied met dino's, lava en vulkanische decoratie voordat de waterdrops voor de echte familiesensatie zorgen. Omdat de rit zowel thematisch rijk als nat is, werkt DinoSplash goed als brug tussen kinderattracties en zwaardere waterthrills.

Normal 15 min
Average 18 min
Highest measurement 70 min Measured at 05-07 15:10
Type Ride
Category Log flume
Photos
RCDB

Coaster profile

Classification

Scale family_thrill
Official type Log flume
Minimum height 100 cm
Unaccompanied height 140 cm
Track length 1,706.0 ft (520.0 m)
Maximum height 52.5 ft (16.0 m)
Ride duration 4:00 min
Manufacturer Mack Rides
Ride model Log Flume
Opening date July 1, 1989
Riders per boat 4
Theme Dinosaurs, volcanoes and lava
Primary source Plopsaland official attraction page

Tracks

Length 1,706.0 ft (520.0 m)
Height 52.5 ft (16.0 m)
Ride duration 4:00

Trains

Arrangement 4 riders per boat
Riders per train 4

Notes

Officiele Plopsaland-informatie bevestigt 16 meter hoogte, 520 meter baanlengte, 4 minuten ritduur en 100/140 cm lengteband. Coasterpedia bevestigt Mack Rides, openingsdatum 1 juli 1989 en 4 plaatsen per boot.

Theming

Dinosaurusthema met prehistorische omgeving, levensechte dino's, vulkanen en lava-effecten rond de logflume-route.

Data

Wait statistics

Based on available measurements and historical wait-time data.

Now 30 min
Normal 15 min
Average 18 min
Highest measurement 70 min Measured at 05-07 15:10
Measurements 4175
Outage measurements 489
Avg. outage duration 56 min
Often busy 15:00 25 min average
Often quiet 10:00 0 min average
Reliability High 4251 measurements, 12 hour blocks
Distribution

Boxplots

Spread of wait times, outage duration, and the number of outages per day based on available historical data.

Wait times

4175 measurements

0 min 20 min 40 min 60 min 80 min
Min
0 min
Q1
5 min
Median
15 min
Q3
30 min
Max
70 min

Typical wait time: around 15 min.

It usually falls between 5 min and 30 min.

See more than 30 min? It is probably busier than usual — consider a quieter moment.

Less than 5 min? You are in luck: that does not happen often.

Outage duration

39 outages

0 min 30 min 60 min 90 min 120 min
Min
1 min
Q1
5 min
Median
5 min
Q3
68 min
Max
115 min

Outages usually last about 5 min.

Some are over quickly (sometimes within 5 min), others take longer (up to 68 min). That varies per outage.

Already longer than 68 min? The attraction may stay closed a while longer.

Outages per day

22 days

0 1 2 3
Min
1
Q1
2
Median
2
Q3
2
Max
3

On days with outages, we see an average of 2 per day.

That usually falls between 2 and 2.

On quiet days it was 1, on busy days up to 3.

Historical

Wait-time build-up

Today compared with historical wait times by hour.

Today Expected Historical Outage
Horizontal axis hours, vertical axis queue minutes. 0 min 15 min 30 min 45 min 10:00 12:00 14:00 16:00 18:00 19:00