

Phantasialand opens new attraction: adventurous climbing trail around Black Mamba
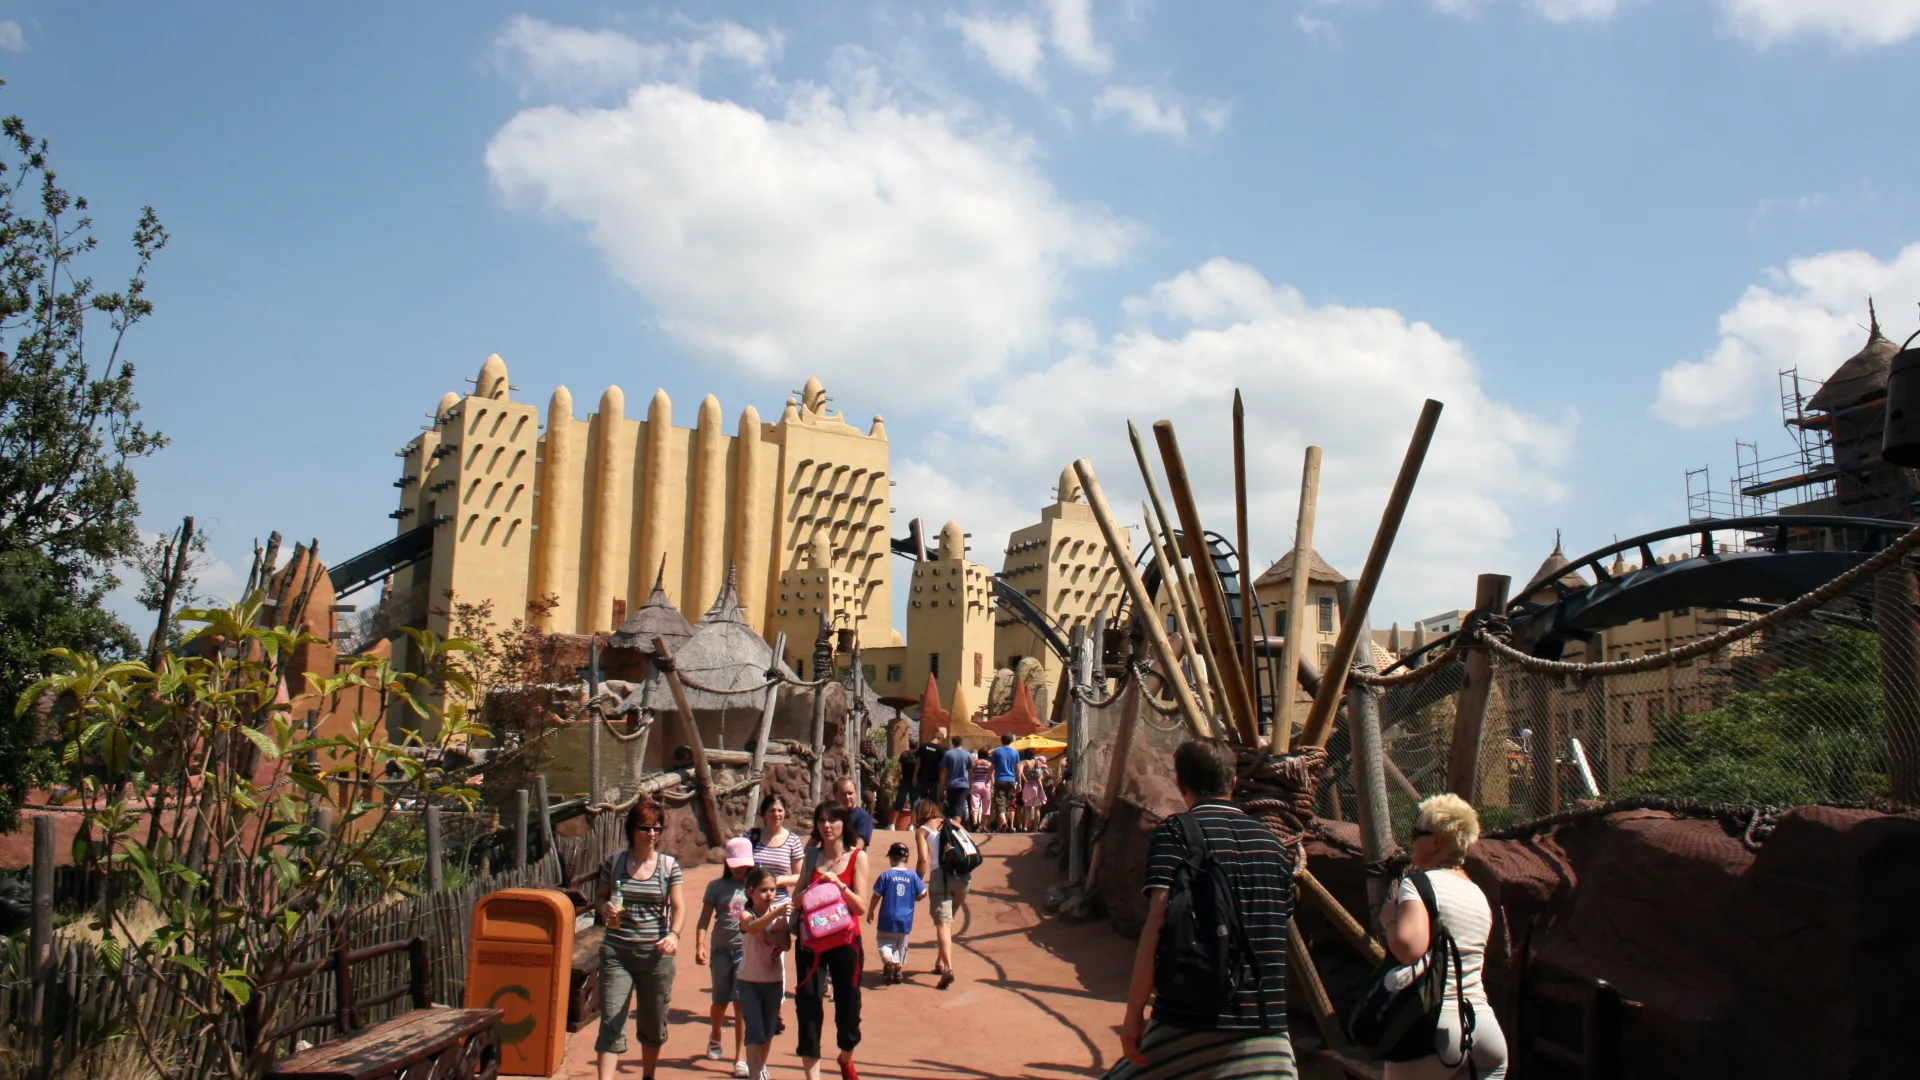
Deep in Africa - Adventure Trail opened at Phantasialand on 12 July 2022 as the African area second attraction. The route around Black Mamba combines bridges, glass floors, water effects, a rolling slide and themed scenery into an active walkthrough.
More context
On 12 July 2022, Phantasialand opened Deep in Africa - Adventure Trail, a new adventure course woven into the African-themed area around Black Mamba. It gave Deep in Africa its first second attraction since the B&M inverted coaster opened in 2006. Looopings described a route filled with rope and wobble bridges, glass floors, stepping stones, hanging pots above the water, a drop pole, a rolling slide, fountains, waterfalls and sound effects. The trail finishes in a covered section with African decorations, giving the route a clear endpoint rather than feeling like a simple playground. For guests, the addition changed the way the area could be used. Deep in Africa was no longer only a dramatic queue and coaster setting for thrill seekers; families and visitors who prefer active exploration gained their own reason to linger there. The attraction is included in park admission, making it a low-threshold extra experience. Historically, the opening fits Phantasialand's habit of making existing themed worlds denser and more layered. The article also noted the connection to Belgian designer Eric Daman, who died earlier in 2022 and helped shape the atmosphere of Deep in Africa.