

← Back to LEGOLAND Deutschland
Ride details

MAXIMUS - The Guardian’s Flight

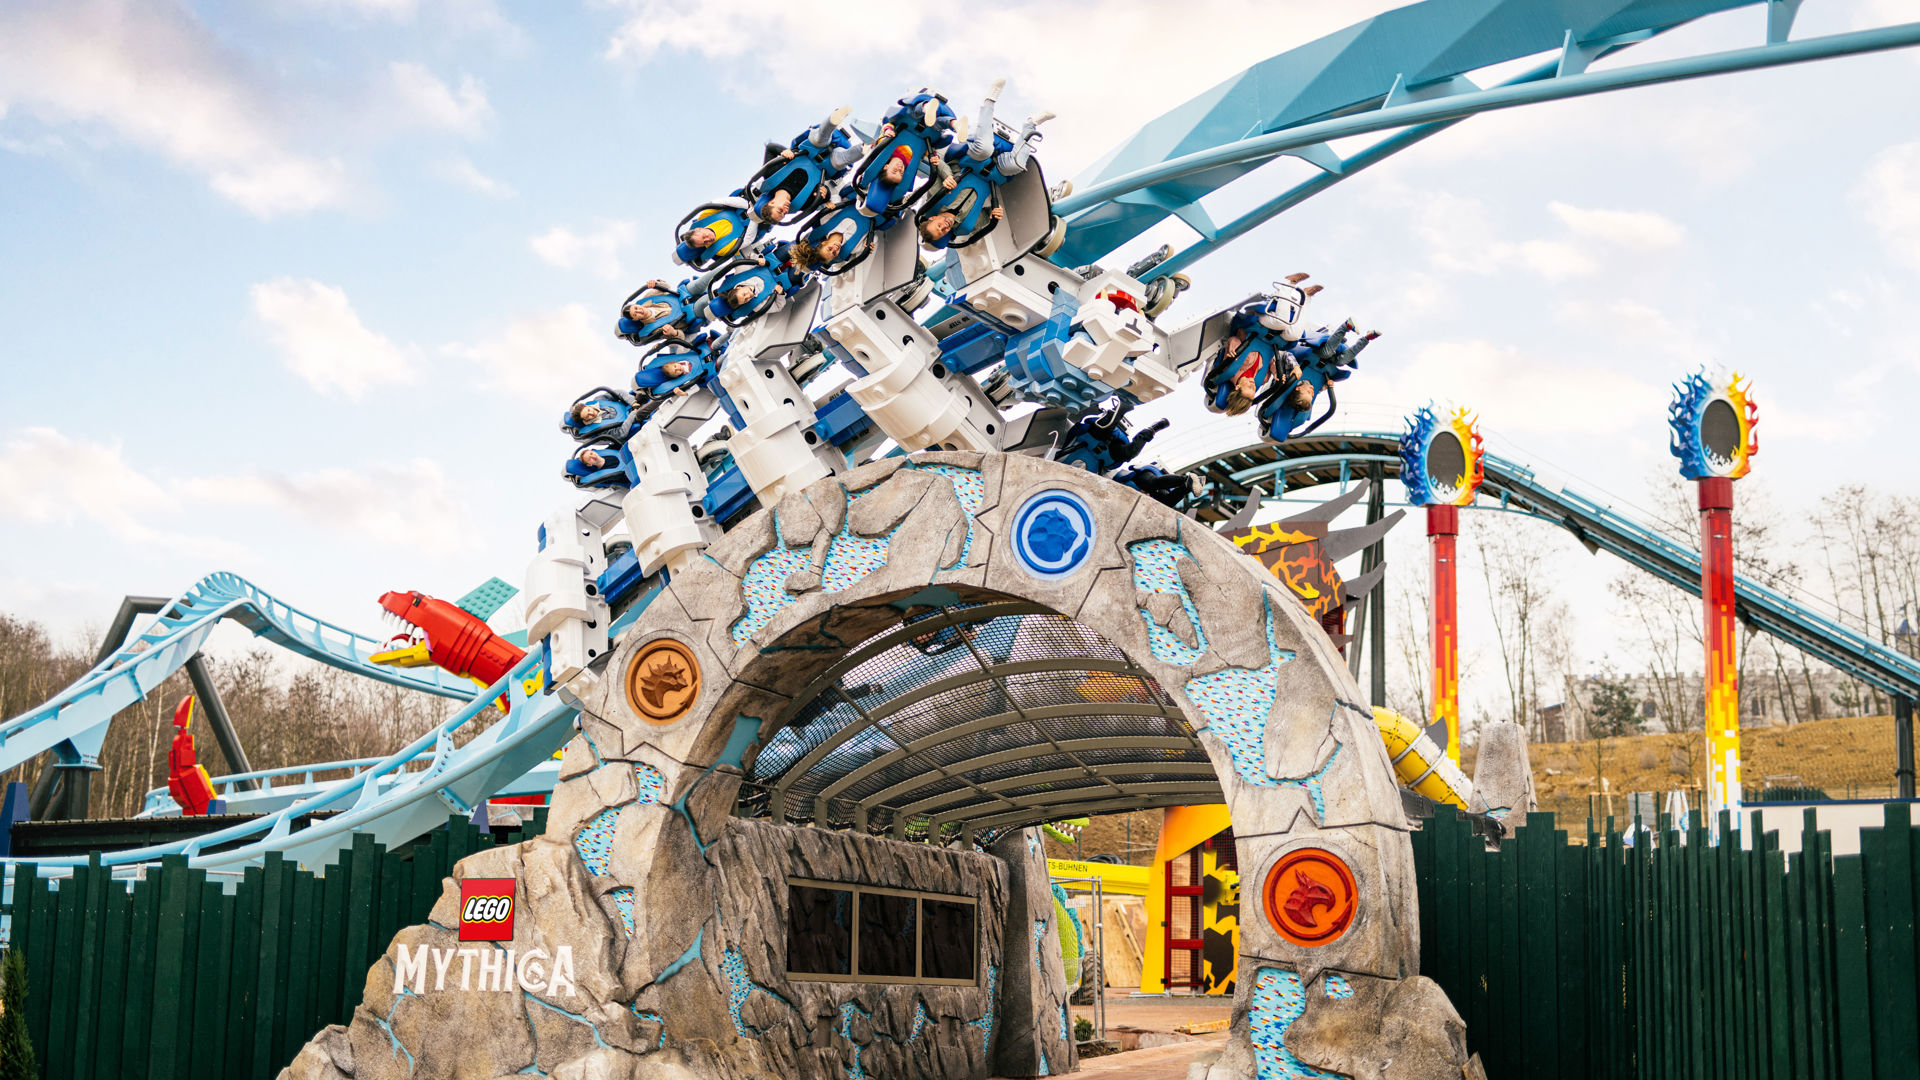
B&M Wing Coaster in LEGO MYTHICA waarin Maximus met twee inversies boven het gebied vliegt.

MAXIMUS - The Guardian's Flight is de grote achtbaan van LEGO MYTHICA. De trein hangt als een wing coaster naast de baan, waardoor je met vrije benen door de helix, kurkentrekker en heartline roll gaat. Voor LEGOLAND-begrippen is dit een forse stap omhoog in spanning, maar de rit blijft compact genoeg om als brug tussen familierit en thrillcoaster te werken.

Normal 20 min
Average 20 min
Highest measurement 60 min Measured at 29-07 12:02
Type Ride
Category Roller coaster
Photos
RCDB

Coaster profile

View on RCDB

Classification

RCDB #19912
RCDB status Operating since March 25, 2023
Classification Roller Coaster
Track type Steel
Design Wing Coaster
Scale Extreme
Categories Roller Coaster, Steel, Wing, Extreme
G-force 2.2 g
Installer RCS GmbH
Official speed wording 15 metres per second
Official maximum height 200 cm

Tracks

Length 1,499.3 ft (457.0 m)
Height 55.8 ft (17.0 m)
Speed 33.6 mph (54.1 km/h)
Inversions 2
Ride duration 1:17

Trains

Arrangement 2 treinen met 5 wagens per trein; rijders zitten 4 naast elkaar op 1 rij, samen 20 rijders per trein.
Trains 2
Cars per train 5
Rows per car 1
Riders per row 4
Riders per train 20

Location

LEGO MYTHICA

Notes

RCDB vermeldt 457,0 meter baanlengte, 17,0 meter hoogte, 54,1 km/u, twee inversies en een ritduur van 1:17. De officiele LEGOLAND-pagina noemt de eerste LEGOLAND Wing Coaster, 17 meter hoogte, 15 meter per seconde en de corkscrew. Coasterpedia noemt 25 maart 2023 als openingsdatum.

Theming

LEGO MYTHICA-thema rond Maximus, de gevleugelde bewaker, met vluchtgevoel door wing-seating en vrije benen naast de baan.

Data

Wait statistics

Based on available measurements and historical wait-time data.

Now Closed
Normal 20 min
Average 20 min
Highest measurement 60 min Measured at 29-07 12:02
Measurements 1229
Outage measurements 0
Avg. outage duration -
Often busy 17:00 28 min average
Often quiet 10:00 15 min average
Reliability High 1301 measurements, 8 hour blocks
Distribution

Boxplots

Spread of wait times, outage duration, and the number of outages per day based on available historical data.

Wait times

1229 measurements

0 min 15 min 30 min 45 min 60 min
Min
5 min
Q1
10 min
Median
20 min
Q3
25 min
Max
60 min

Typical wait time: around 20 min.

It usually falls between 10 min and 25 min.

See more than 25 min? It is probably busier than usual — consider a quieter moment.

Less than 10 min? You are in luck: that does not happen often.

Outage duration

Not enough data yet for a boxplot.

This attraction has not reported any outages to us yet. We cannot say anything meaningful about it here.

Outages per day

Not enough data yet for a boxplot.

This attraction has not reported any outages to us yet. We cannot say anything meaningful about it here.

Historical

Wait-time build-up

Today compared with historical wait times by hour.

Today Expected Historical
Horizontal axis hours, vertical axis queue minutes. 0 min 10 min 20 min 30 min 10:00 12:00 14:00 16:00 18:00 20:00 22:00