

← Back to LEGOLAND Deutschland
Ride details

LEGO® NINJAGO® The Ride

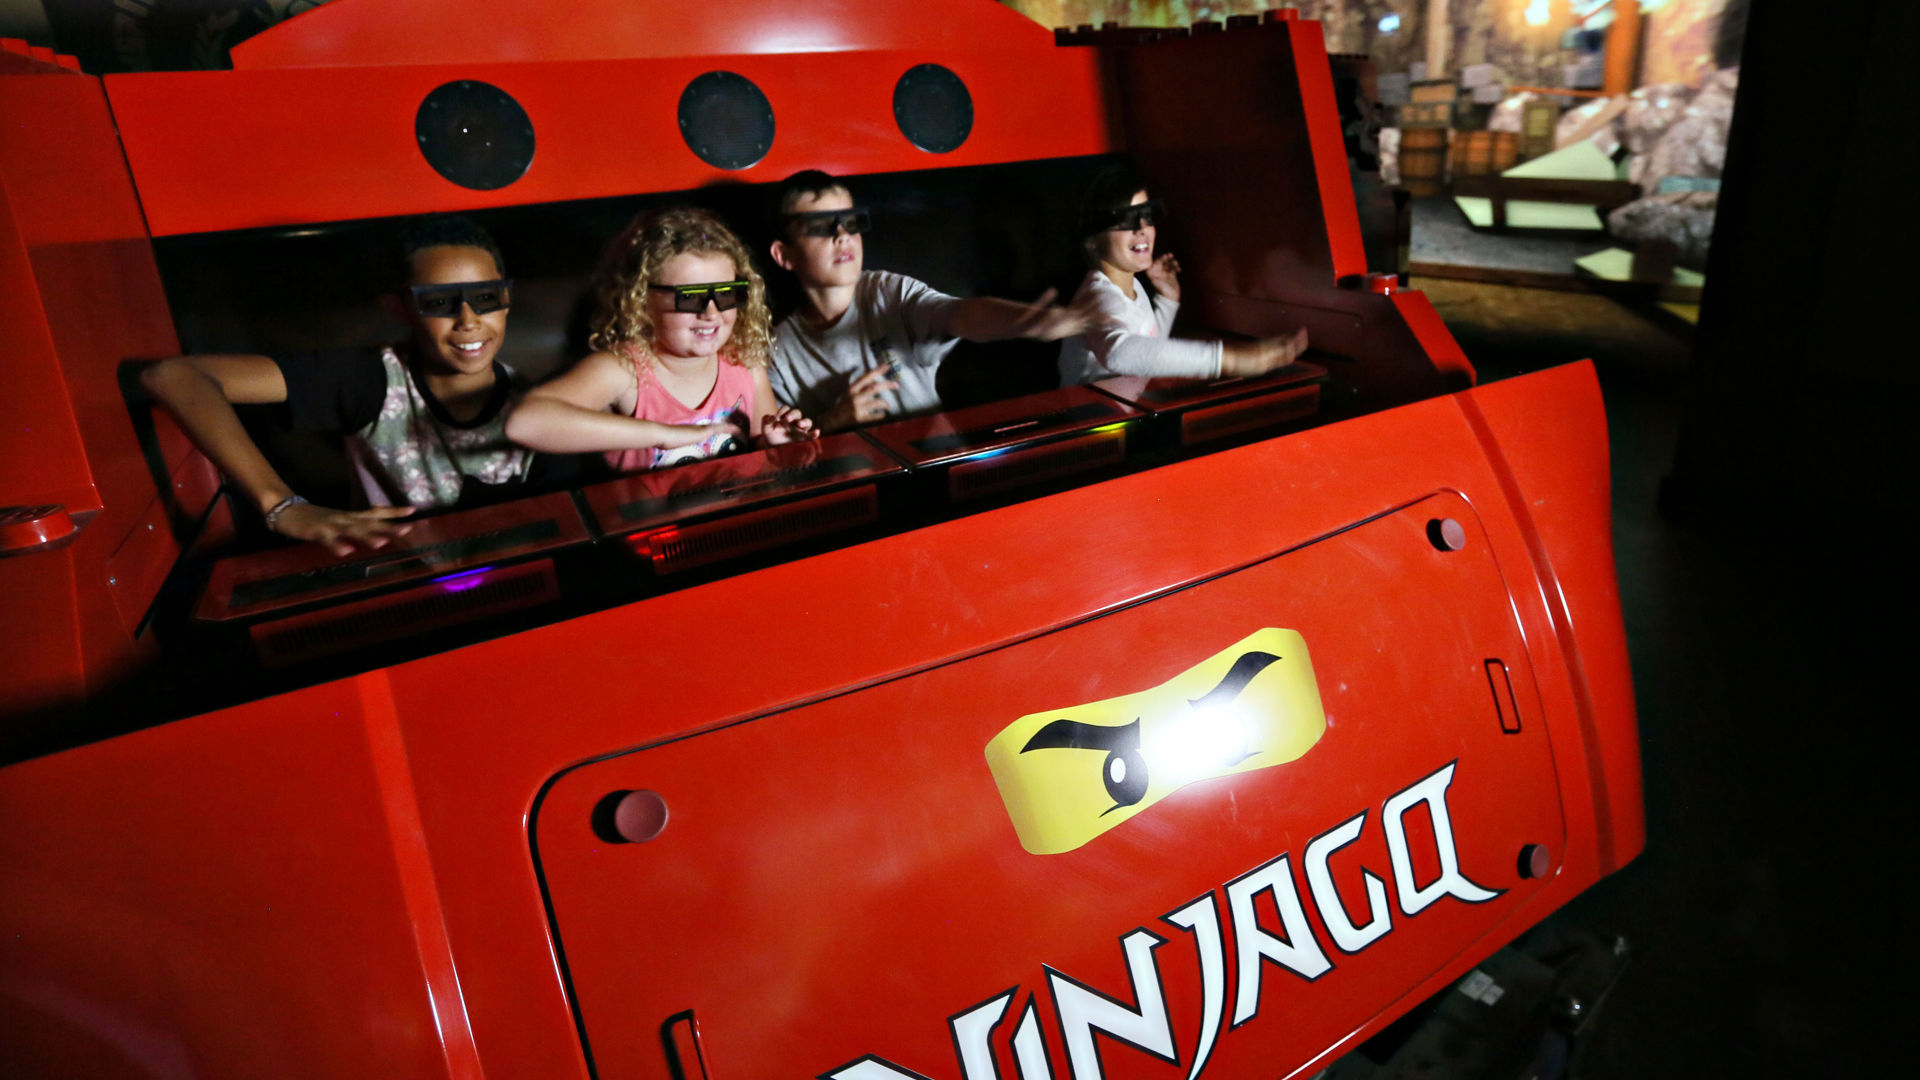
LEGO NINJAGO The Ride is een interactieve 4D-darkride waarin handbewegingen worden gebruikt om virtuele vijanden te raken.

LEGO NINJAGO The Ride maakt van bezoekers zelf ninjastrijders. In plaats van een pistool of knop gebruik je je handen om vuur, ijs, bliksem en lucht op het scherm af te vuren. De rit combineert voertuigen, 3D-beelden en effecten als licht, mist en warmte, waardoor de scorestrijd tegen de Great Devourer vooral draait om timing en herhalen: nog een keer instappen voelt meteen logisch als iemand in je groep hoger eindigt.

Normal 10 min
Average 14 min
Highest measurement 50 min Measured at 27-07 13:18
Type Ride
Category Dark Ride
Photos
RCDB

Coaster profile

Classification

Scale family
Opening year 2017
Vehicles 10 vehicles with 8 seats each
Technology Triotech Maestro hand gesture interaction with illusio projection technology

Tracks

Length 400.3 ft (122.0 m)
Ride duration 4:00

Trains

Capacity per hour 1,000

Notes

Triotech beschrijft de attractie als een hands-free interactieve darkride met Maestro-technologie. Dark Ride Database noemt 2017 als openingsjaar, ART Engineering als ridesysteem, Themrise als theming, 10 voertuigen, 8 zitplaatsen per voertuig en 1000 personen per uur.

Theming

NINJAGO-gevecht tegen de Great Devourer met 3D-animatie, 4D-effecten en hands-free elementkrachten.

Data

Wait statistics

Based on available measurements and historical wait-time data.

Now Closed
Normal 10 min
Average 14 min
Highest measurement 50 min Measured at 27-07 13:18
Measurements 1232
Outage measurements 0
Avg. outage duration -
Often busy 17:00 14 min average
Often quiet 10:00 8 min average
Reliability High 1313 measurements, 8 hour blocks
Distribution

Boxplots

Spread of wait times, outage duration, and the number of outages per day based on available historical data.

Wait times

1232 measurements

0 min 15 min 30 min 45 min 60 min
Min
5 min
Q1
5 min
Median
10 min
Q3
20 min
Max
50 min

Typical wait time: around 10 min.

It usually falls between 5 min and 20 min.

See more than 20 min? It is probably busier than usual — consider a quieter moment.

Less than 5 min? You are in luck: that does not happen often.

Outage duration

Not enough data yet for a boxplot.

This attraction has not reported any outages to us yet. We cannot say anything meaningful about it here.

Outages per day

Not enough data yet for a boxplot.

This attraction has not reported any outages to us yet. We cannot say anything meaningful about it here.

Historical

Wait-time build-up

Today compared with historical wait times by hour.

Today Expected Historical
Horizontal axis hours, vertical axis queue minutes. 0 min 5 min 10 min 15 min 20 min 10:00 12:00 14:00 16:00 18:00 20:00 22:00