

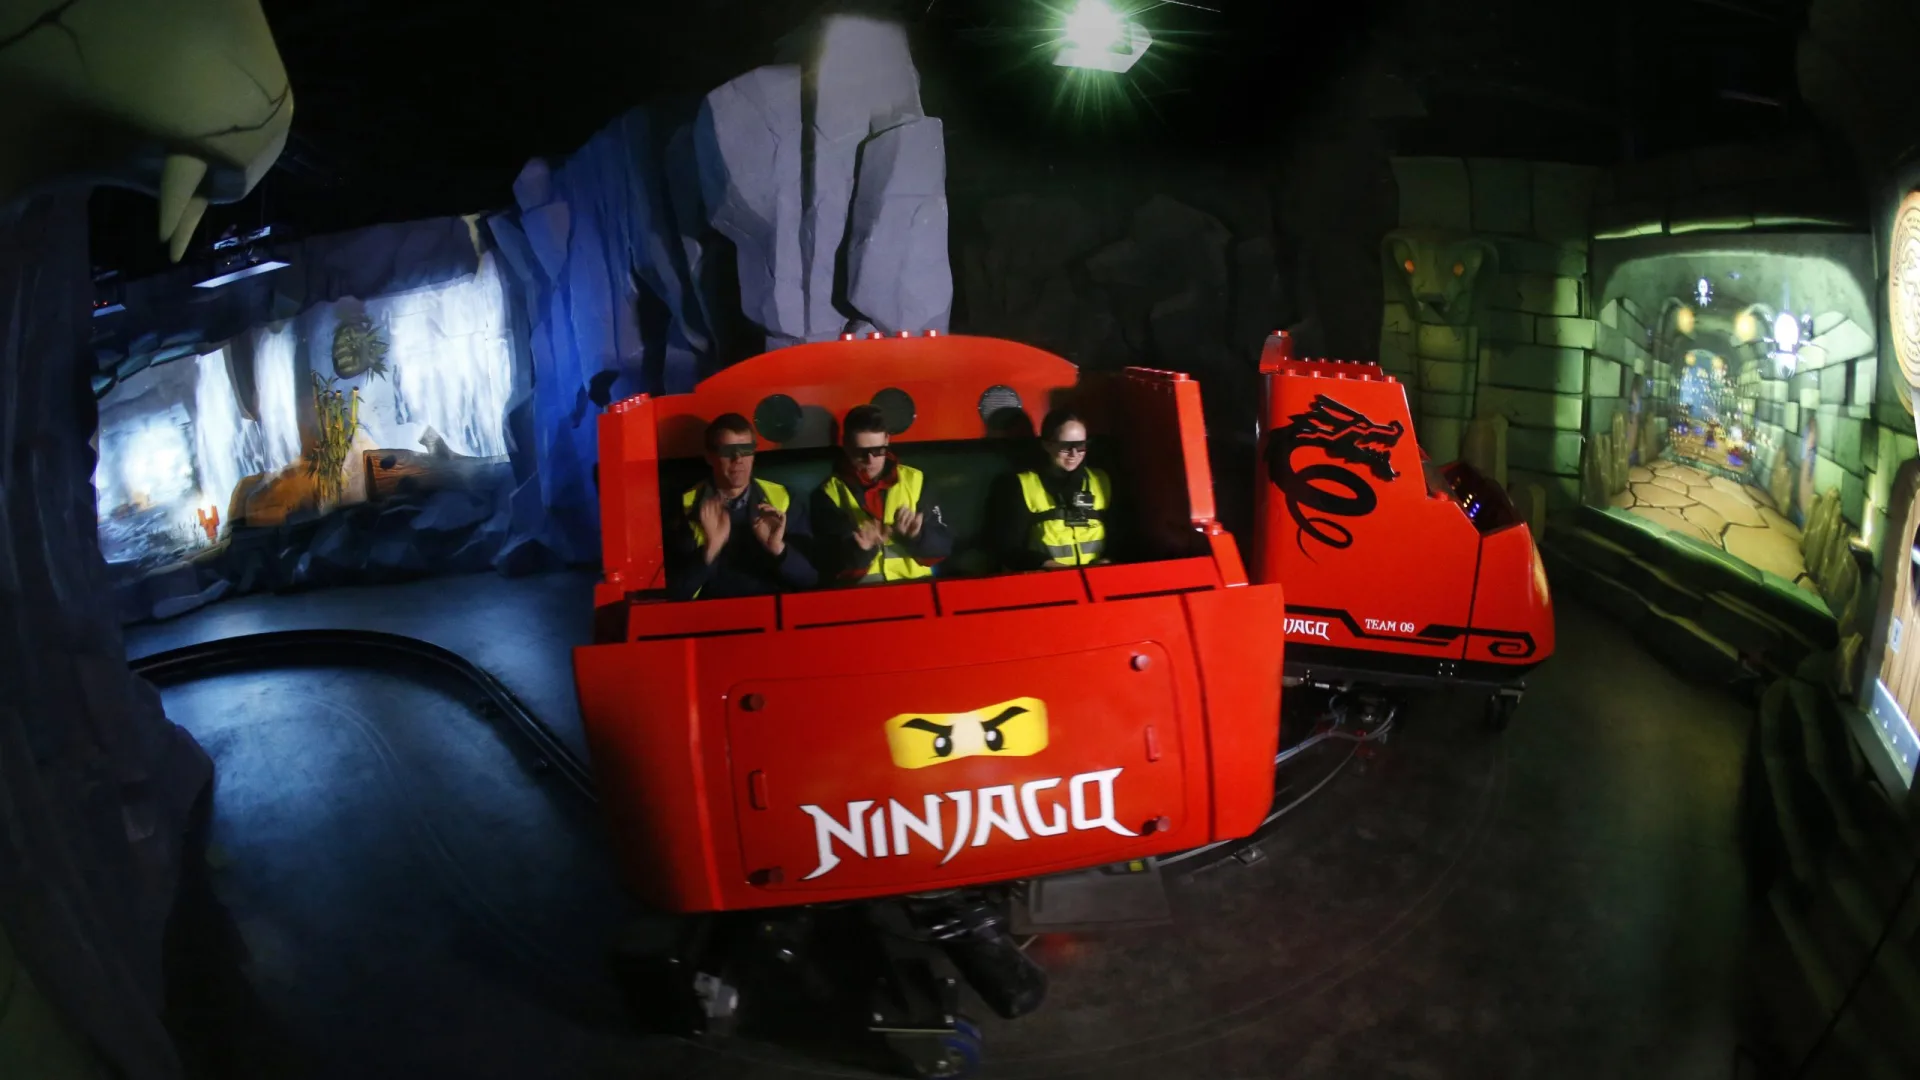
Photo 1 of NINJAGO The Ride
← Back to LEGOLAND Billund LEGOLAND Billund park info Opening hours LEGOLAND Billund
Ride details

NINJAGO The Ride

NINJAGO The Ride is een interactieve 3D-darkride waarin bezoekers met handbewegingen de elementen afvuren.

NINJAGO The Ride maakt van de wachtrij geen passieve kijkervaring maar een teammissie. Met 3D-bril op trainen bezoekers eerst vuur, aarde, bliksem en ijs, waarna ze met hun handen projectielen op het scherm sturen. De rit gebruikt geen pistolen; juist die hands-free besturing maakt de scorestrijd tegen The Great Devourer toegankelijk en verrassend fysiek.

Normal 10 min
Average 14 min
Highest measurement 70 min Measured at 14-10 12:01
Type Ride
Category Dark Ride
Photos
RCDB

Coaster profile

Classification

Scale family
Vehicles 10 vehicles with 8 seats each
Technology Triotech Maestro hand gesture interaction
Official note Not recommended for children under five due to lights and sounds

Tracks

Length 400.3 ft (122.0 m)
Ride duration 4:00

Trains

Capacity per hour 1,000

Notes

De officiële parkpagina beschrijft handbewegingen, 3D-brillen en het gevecht tegen The Great Devourer. Dark Ride Database vermeldt 19 maart 2016 als openingsdatum, 10 voertuigen, 8 zitplaatsen per voertuig, 1000 personen per uur en 122 meter ritlengte.

Theming

NINJAGO-gevecht met vuur, aarde, bliksem en ijs tegen The Great Devourer, met 3D-bril en hands-free Maestro-techniek.

Data

Wait statistics

Based on available measurements and historical wait-time data.

Now No data
Normal 10 min
Average 14 min
Highest measurement 70 min Measured at 14-10 12:01
Measurements 1688
Outage measurements 0
Avg. outage duration -
Often busy 15:00 13 min average
Often quiet 10:00 5 min average
Reliability High 1826 measurements, 10 hour blocks
Distribution

Boxplots

Spread of wait times, outage duration, and the number of outages per day based on available historical data.

Wait times

1688 measurements

0 min 20 min 40 min 60 min 80 min
Min
0 min
Q1
5 min
Median
10 min
Q3
20 min
Max
70 min

Typical wait time: around 10 min.

It usually falls between 5 min and 20 min.

See more than 20 min? It is probably busier than usual — consider a quieter moment.

Less than 5 min? You are in luck: that does not happen often.

Outage duration

Not enough data yet for a boxplot.

This attraction has not reported any outages to us yet. We cannot say anything meaningful about it here.

Outages per day

Not enough data yet for a boxplot.

This attraction has not reported any outages to us yet. We cannot say anything meaningful about it here.

Historical

Wait-time build-up

Today compared with historical wait times by hour.

Today Expected Historical
Horizontal axis hours, vertical axis queue minutes. 0 min 5 min 10 min 15 min 20 min 08:00 10:00 12:00 14:00 16:00 18:00 19:00