

← Back to LEGOLAND Billund
Ride details

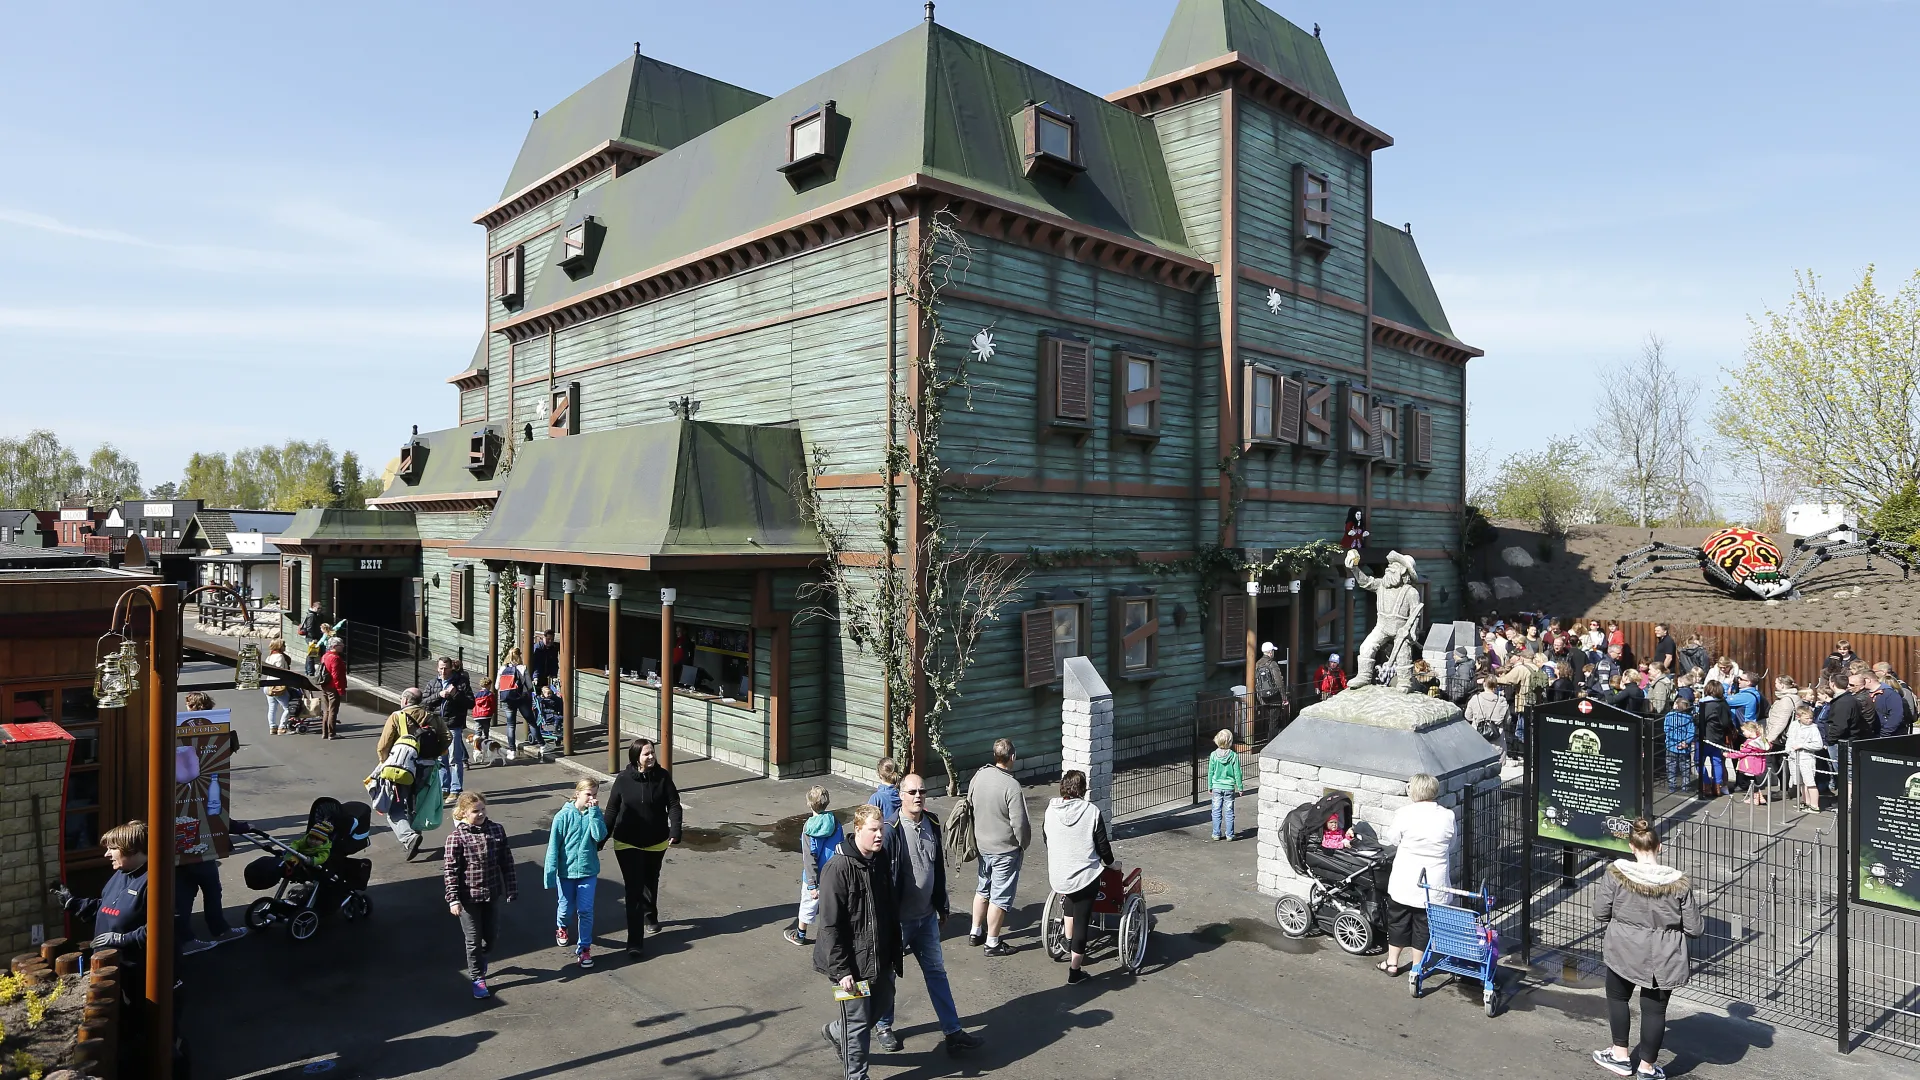
Ghost – The Haunted House

Ghost - The Haunted House combineert een spookhuis-walkthrough met een donkere vrijeval-finale.

Ghost - The Haunted House begint als een speelse spooktocht door LEGOREDO Town. Bezoekers lopen langs krakende vloeren, een betoverd spiegeldoolhof en kamers vol spoken, monsters en kleine schrikmomenten. Daarna verandert de toon: The Crazy Scientist lokt de groep naar zijn kelderexperiment, waar de walkthrough eindigt in een korte maar verrassende vrijeval in het donker.

Normal 10 min
Average 14 min
Highest measurement 60 min Measured at 28-07 16:32
Type Ride
Category Dark Ride
Photos
RCDB

Coaster profile

Classification

Scale family_thrill
Opening year 2014
Walkthrough 9 scary scenes before the ride finale
Finale Two drop towers raise guests 8 metres before a dark free fall

Tracks

Height 26.2 ft (8.0 m)

Notes

De officiële LEGOLAND Billund-pagina beschrijft krakende vloeren, een betoverd spiegeldoolhof en mysterieuze verrassingen in het spookhuis. Lagotronics beschrijft de attractie als walkthrough met negen scènes, interactieve elementen en twee vrijevaltorens die gasten 8 m optillen voor een donkere valfinale. De bestaande profielwaarden bewaren ABC Rides, 8 m hoogte en 110 cm minimumlengte.

Theming

Humoristisch spookhuisthema met spoken, monsters, spiegeldoolhof, The Crazy Scientist en een donkere kelderfinale.

Data

Wait statistics

Based on available measurements and historical wait-time data.

Now Closed
Normal 10 min
Average 14 min
Highest measurement 60 min Measured at 28-07 16:32
Measurements 684
Outage measurements 0
Avg. outage duration -
Often busy 18:00 15 min average
Often quiet 10:00 0 min average
Reliability High 734 measurements, 9 hour blocks
Distribution

Boxplots

Spread of wait times, outage duration, and the number of outages per day based on available historical data.

Wait times

684 measurements

0 min 15 min 30 min 45 min 60 min
Min
0 min
Q1
0 min
Median
10 min
Q3
20 min
Max
60 min

Typical wait time: around 10 min.

It usually falls between 0 min and 20 min.

See more than 20 min? It is probably busier than usual — consider a quieter moment.

Less than 0 min? You are in luck: that does not happen often.

Outage duration

Not enough data yet for a boxplot.

This attraction has not reported any outages to us yet. We cannot say anything meaningful about it here.

Outages per day

Not enough data yet for a boxplot.

This attraction has not reported any outages to us yet. We cannot say anything meaningful about it here.

Historical

Wait-time build-up

Today compared with historical wait times by hour.

Today Expected Historical
Horizontal axis hours, vertical axis queue minutes. 0 min 5 min 10 min 15 min 20 min 10:00 12:00 14:00 16:00 18:00 19:00