

Wait times
Not enough data yet for a boxplot.
There are not enough wait-time measurements yet to spot a pattern.
You can temporarily save favorites in cookies. Create a free account or log in to use them on every device.
Drag parks to set your own order.
You have no favorite parks yet. Tap the star on a park to add one.
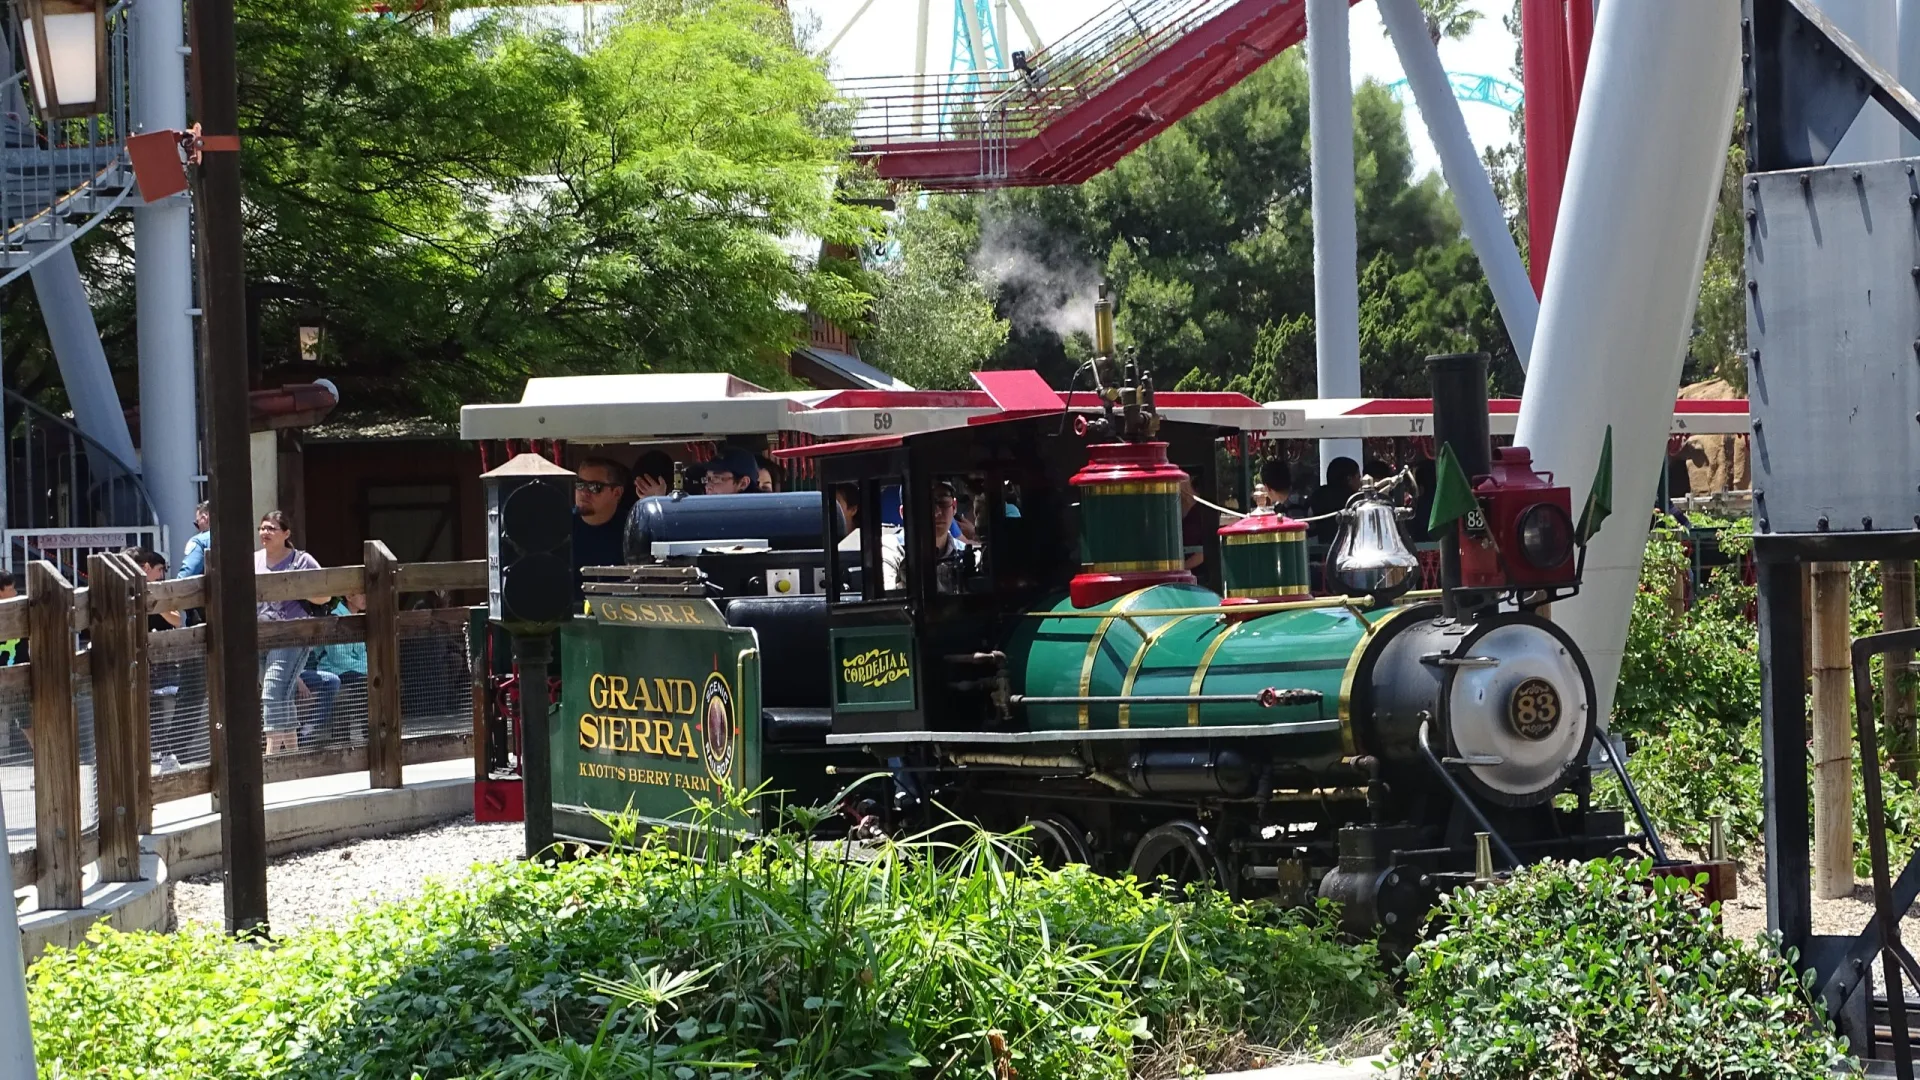
Rustige Camp Snoopy-miniatuurtrein langs Peanuts-scenes en jamboree-decor.
Beagle Express Railroad is de vriendelijke treinrit van Camp Snoopy. De route voert langs kleine kampmomenten met Snoopy, Charlie Brown, Lucy en de Beagle Scouts, waardoor de rit meer als een korte tour door een stripwereld voelt dan als puur vervoer.
De rit opende in 1983 als onderdeel van Camp Snoopy. De oorspronkelijke Crown Metal Products-trein werd in 2024 vervangen door een nieuwe elektrische trein bij de Beagle Express-vernieuwing.
De huidige presentatie draait om een Camp Snoopy-jamboree met Peanuts-personages, bruggen, bosdecor en kleine scènes langs de route.
Based on available measurements and historical wait-time data.
Spread of wait times, outage duration, and the number of outages per day based on available historical data.
Not enough data yet for a boxplot.
There are not enough wait-time measurements yet to spot a pattern.
115 outages
On average, an outage lasts about 10 min.
In three out of four cases, the attraction reopens within 19 min.
If it takes longer, expect extra waiting time.
44 days
On days with outages, we see an average of 2 per day.
That usually falls between 2 and 3.
On quiet days it was 1, on busy days up to 7.
Today compared with historical wait times by hour.