

← Back to Hong Kong Disneyland Park
Ride details

The Royal Reception Hall

Koninklijke indoor meet-and-greet in Castle of Magical Dreams met Disney-prinsessen en queens.

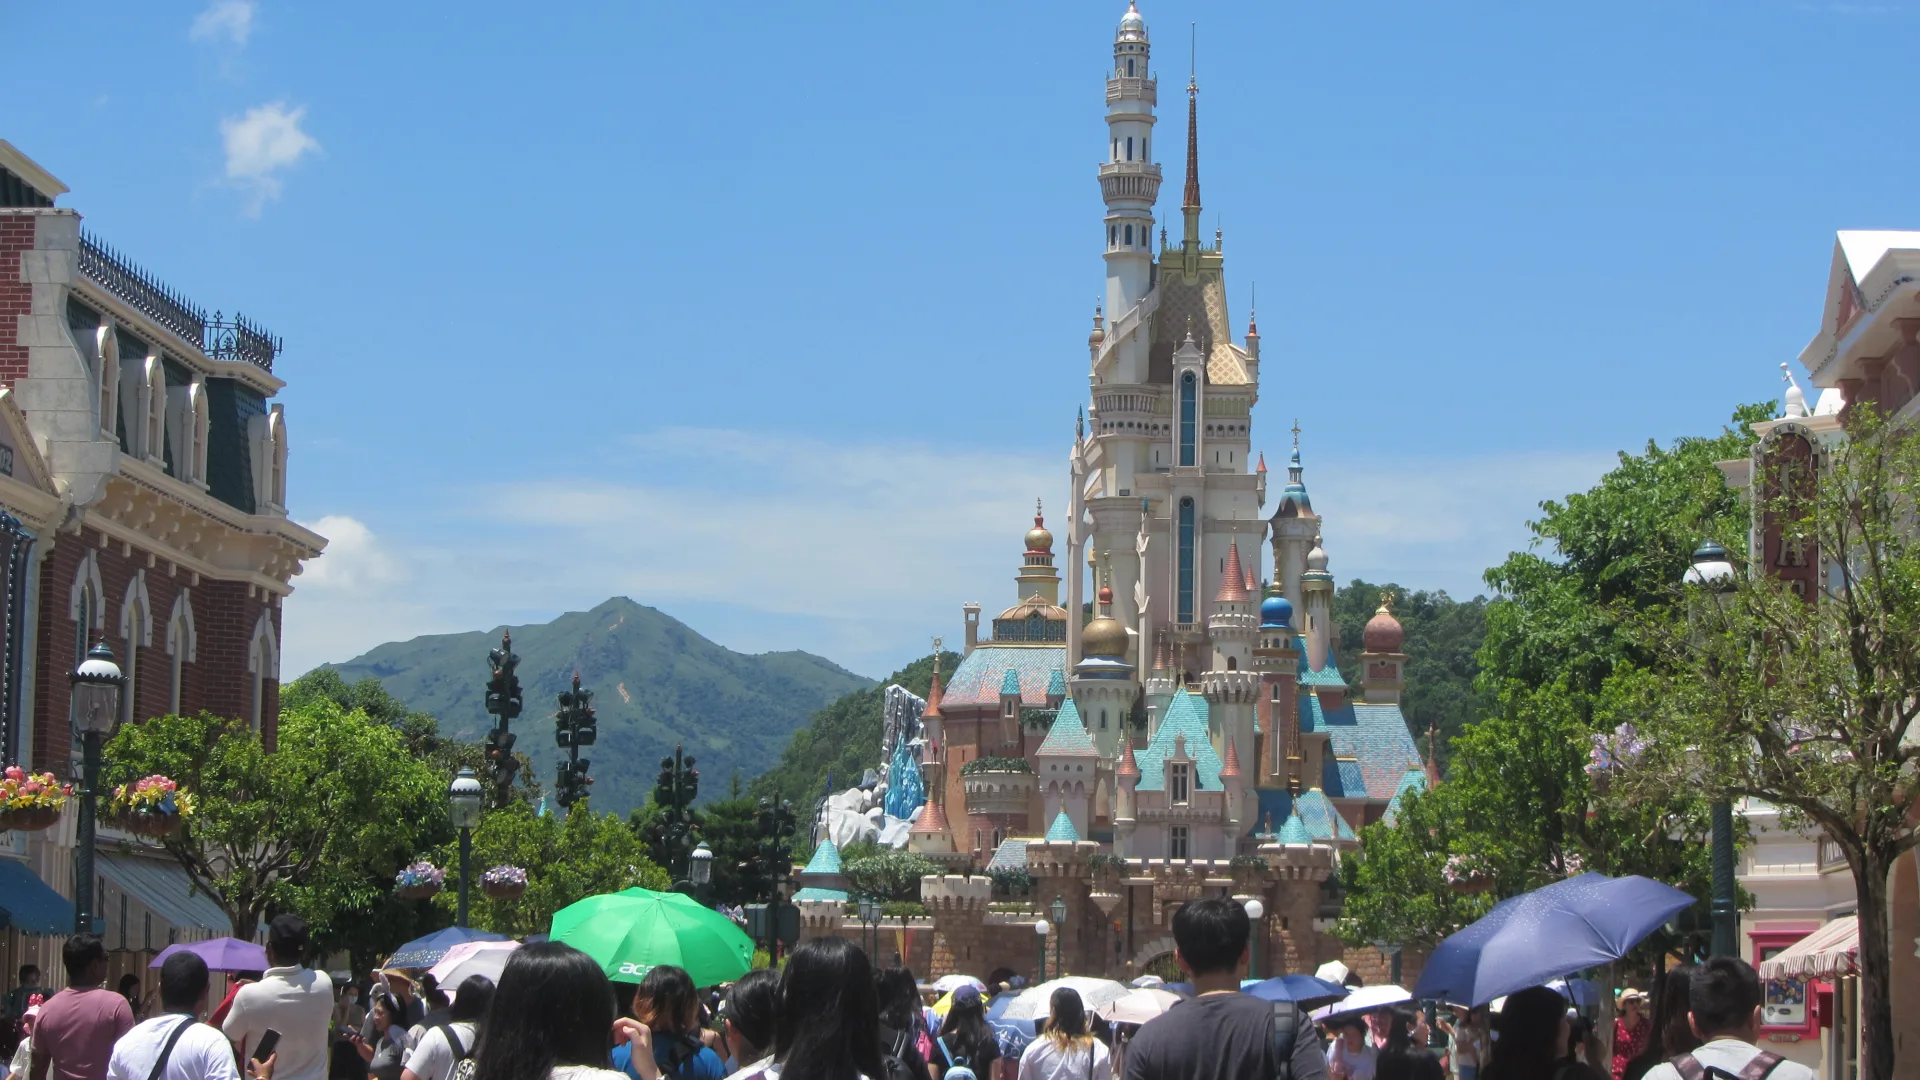
The Royal Reception Hall is geen rit, maar een rustig karaktermoment in het hart van Castle of Magical Dreams. Je stapt een rijk aangeklede kasteelruimte binnen waar prinsessen en queens gasten ontvangen voor een foto en korte ontmoeting. De ervaring draait om sfeer, kostuums en het kasteeldecor; door de Any Height-regel en rolstoeltoegankelijke opzet is dit vooral een laagdrempelige stop voor families en Disney-fans.

Normal 30 min
Average 39 min
Highest measurement 75 min Measured at 02-07 16:06
Type Ride
Category Show
Photos
RCDB

Coaster profile

Classification

Scale low
Official height rule Any Height
Official area Fantasyland
Official tags Indoor; Character Experience
Location Castle of Magical Dreams

Location

Fantasyland, in Castle of Magical Dreams at Hong Kong Disneyland Park.

Notes

The Royal Reception Hall is de meet-and-greetruimte in Castle of Magical Dreams; het vernieuwde kasteel opende officieel op 21 november 2020.

Theming

De ruimte sluit aan op Castle of Magical Dreams, waarin Disney Princesses en Frozen-queens via torens, symbolen en interieurdetails samenkomen.

Data

Wait statistics

Based on available measurements and historical wait-time data.

Now 20 min
Normal 30 min
Average 39 min
Highest measurement 75 min Measured at 02-07 16:06
Measurements 1654
Outage measurements 30
Avg. outage duration 165 min
Often busy 15:00 45 min average
Often quiet 18:00 10 min average
Reliability High 1808 measurements, 11 hour blocks
Distribution

Boxplots

Spread of wait times, outage duration, and the number of outages per day based on available historical data.

Wait times

1654 measurements

0 min 20 min 40 min 60 min 80 min
Min
10 min
Q1
30 min
Median
40 min
Q3
45 min
Max
75 min

Typical wait time: around 40 min.

It usually falls between 30 min and 45 min.

See more than 45 min? It is probably busier than usual — consider a quieter moment.

Less than 30 min? You are in luck: that does not happen often.

Outage duration

2 outages

0 min 100 min 200 min 300 min 400 min
Min
4 min
Q1
84 min
Median
165 min
Q3
245 min
Max
325 min

On average, an outage lasts about 165 min.

In three out of four cases, the attraction reopens within 245 min.

If it takes longer, expect extra waiting time.

Outages per day

1 day

0 1 2
Min
2
Q1
2
Median
2
Q3
2
Max
2

On days with outages, we see an average of 2 per day.

That usually falls between 2 and 2.

On quiet days it was 2, on busy days up to 2.

Historical

Wait-time build-up

Today compared with historical wait times by hour.

Today Expected Historical
Horizontal axis hours, vertical axis queue minutes. 0 min 15 min 30 min 45 min 10:00 12:00 14:00 16:00 18:00 20:00