

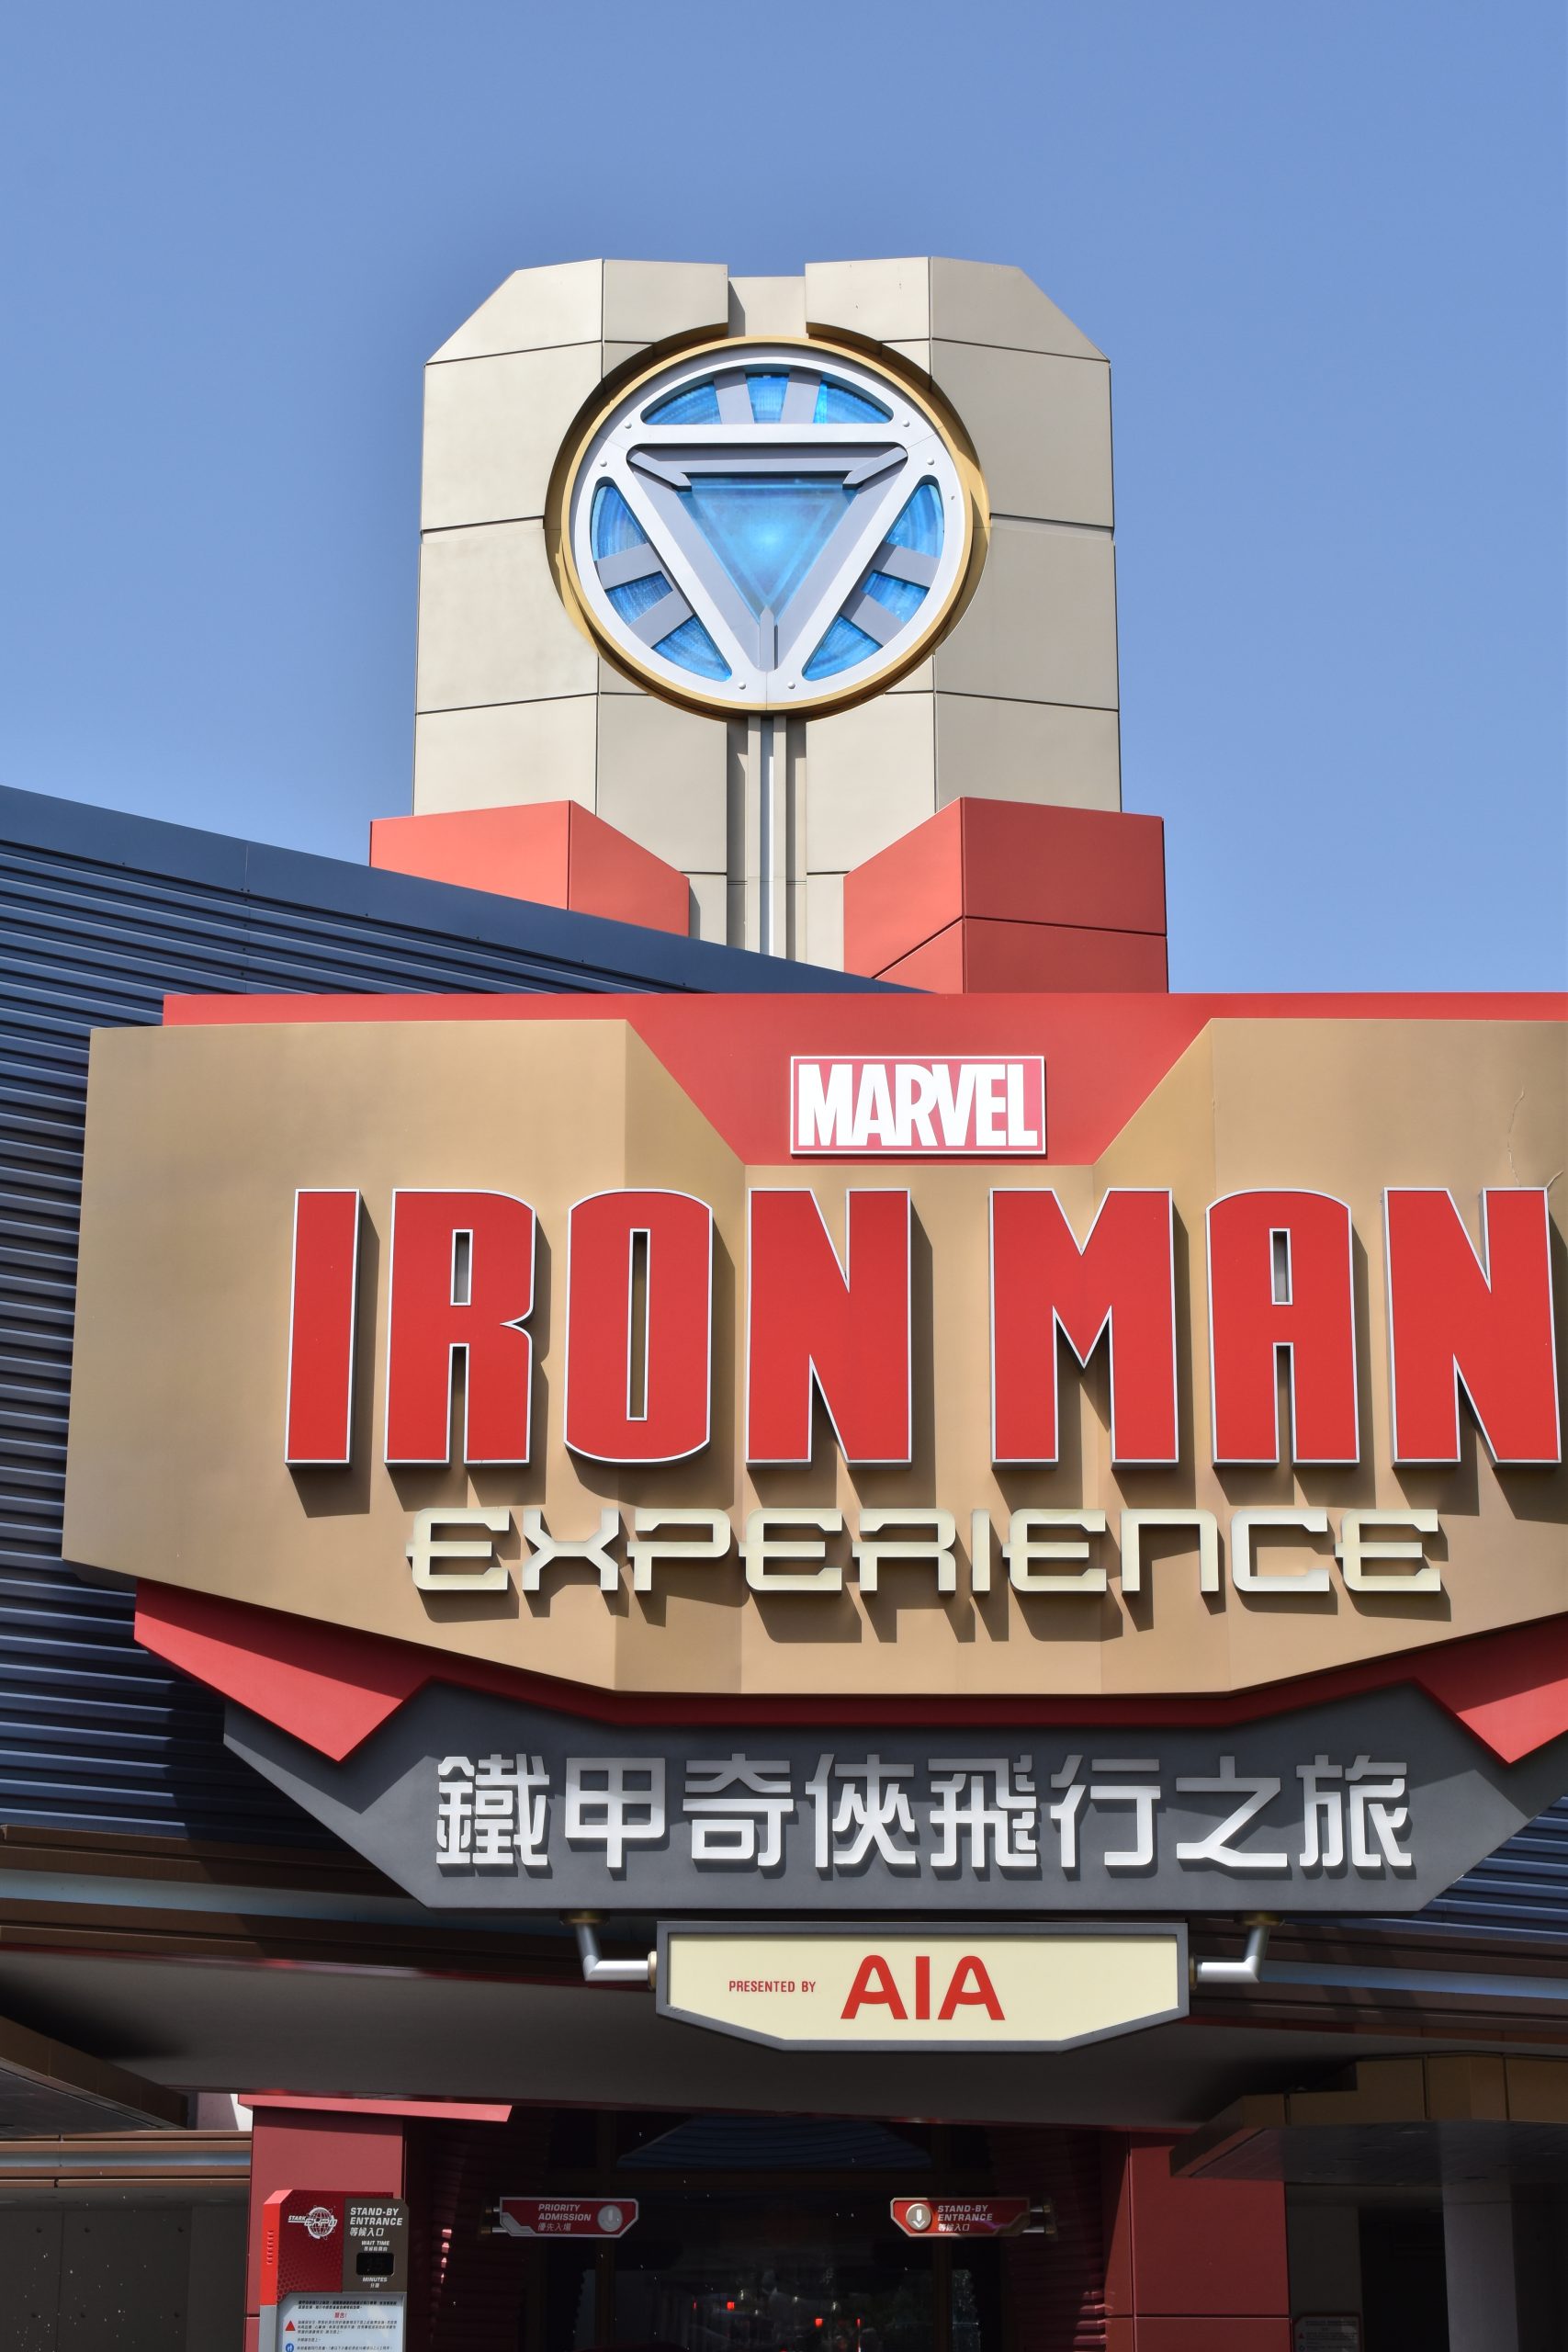
Photo 1 of Iron Man Experience - Presented by AIA
← Back to Hong Kong Disneyland Park Hong Kong Disneyland Park park info Opening hours Hong Kong Disneyland Park
Ride details

Iron Man Experience - Presented by AIA

Iron Man Experience is a 3D motion simulator that sends you flying with Iron Man above Hong Kong and Stark Tower.

Iron Man Experience drops guests right into Stark Expo, where Tony Stark is unveiling his latest tech. After the exhibition, you board the Expo Edition Iron Wing for a flight above Hong Kong, but the demo turns into a rescue mission when Hydra appears around Stark Tower. The ride blends 3D film, motion and Marvel show scenes into a simulator that feels accessible yet full of energy.

Normal 10 min
Average 17 min
Highest measurement 50 min Measured at 10-08 15:49
Type Ride
Category Simulator
Photos
RCDB

Coaster profile

Classification

Scale family_thrill
Official minimum height 102 cm / 40 in
Vehicle type Motion simulator
Riders per vehicle 45
Sponsor AIA Group

Tracks

Ride duration 4:30

Trains

Capacity per hour 2,036

Notes

The official park page lists Tomorrowland, a minimum height of 3 feet 4 inches and the first Marvel ride in a Disney park. Wikipedia adds an opening date of 11 January 2017, Thales Training & Simulation as manufacturer, Walt Disney Imagineering as designer, a ride time of 4 minutes 30 seconds and capacity for 2,036 riders per hour.

Theming

The theme revolves around Stark Expo, StarkVision goggles, the Iron Wing and a Hydra attack on Hong Kong Stark Tower.

Data

Wait statistics

Based on available measurements and historical wait-time data.

Now 5 min
Normal 10 min
Average 17 min
Highest measurement 50 min Measured at 10-08 15:49
Measurements 1374
Outage measurements 1
Avg. outage duration 13 min
Often busy 12:00 15 min average
Often quiet 10:00 5 min average
Reliability High 6887 measurements, 12 hour blocks
Distribution

Boxplots

Spread of wait times, outage duration, and the number of outages per day based on available historical data.

Wait times

1374 measurements

0 min 15 min 30 min 45 min 60 min
Min
5 min
Q1
10 min
Median
15 min
Q3
20 min
Max
50 min

Typical wait time: around 15 min.

It usually falls between 10 min and 20 min.

See more than 20 min? It is probably busier than usual — consider a quieter moment.

Less than 10 min? You are in luck: that does not happen often.

Outage duration

2 outages

0 min 5 min 10 min 15 min 20 min
Min
5 min
Q1
9 min
Median
13 min
Q3
16 min
Max
20 min

On average, an outage lasts about 13 min.

In three out of four cases, the attraction reopens within 16 min.

If it takes longer, expect extra waiting time.

Outages per day

1 day

0 1 2
Min
2
Q1
2
Median
2
Q3
2
Max
2

On days with outages, we see an average of 2 per day.

That usually falls between 2 and 2.

On quiet days it was 2, on busy days up to 2.

Historical

Wait-time build-up

Today compared with historical wait times by hour.

Today Historical
Horizontal axis hours, vertical axis queue minutes. 0 min 5 min 10 min 15 min 20 min 10:00 12:00 14:00 16:00 18:00 20:00