

← Back to Hong Kong Disneyland Park
Ride details

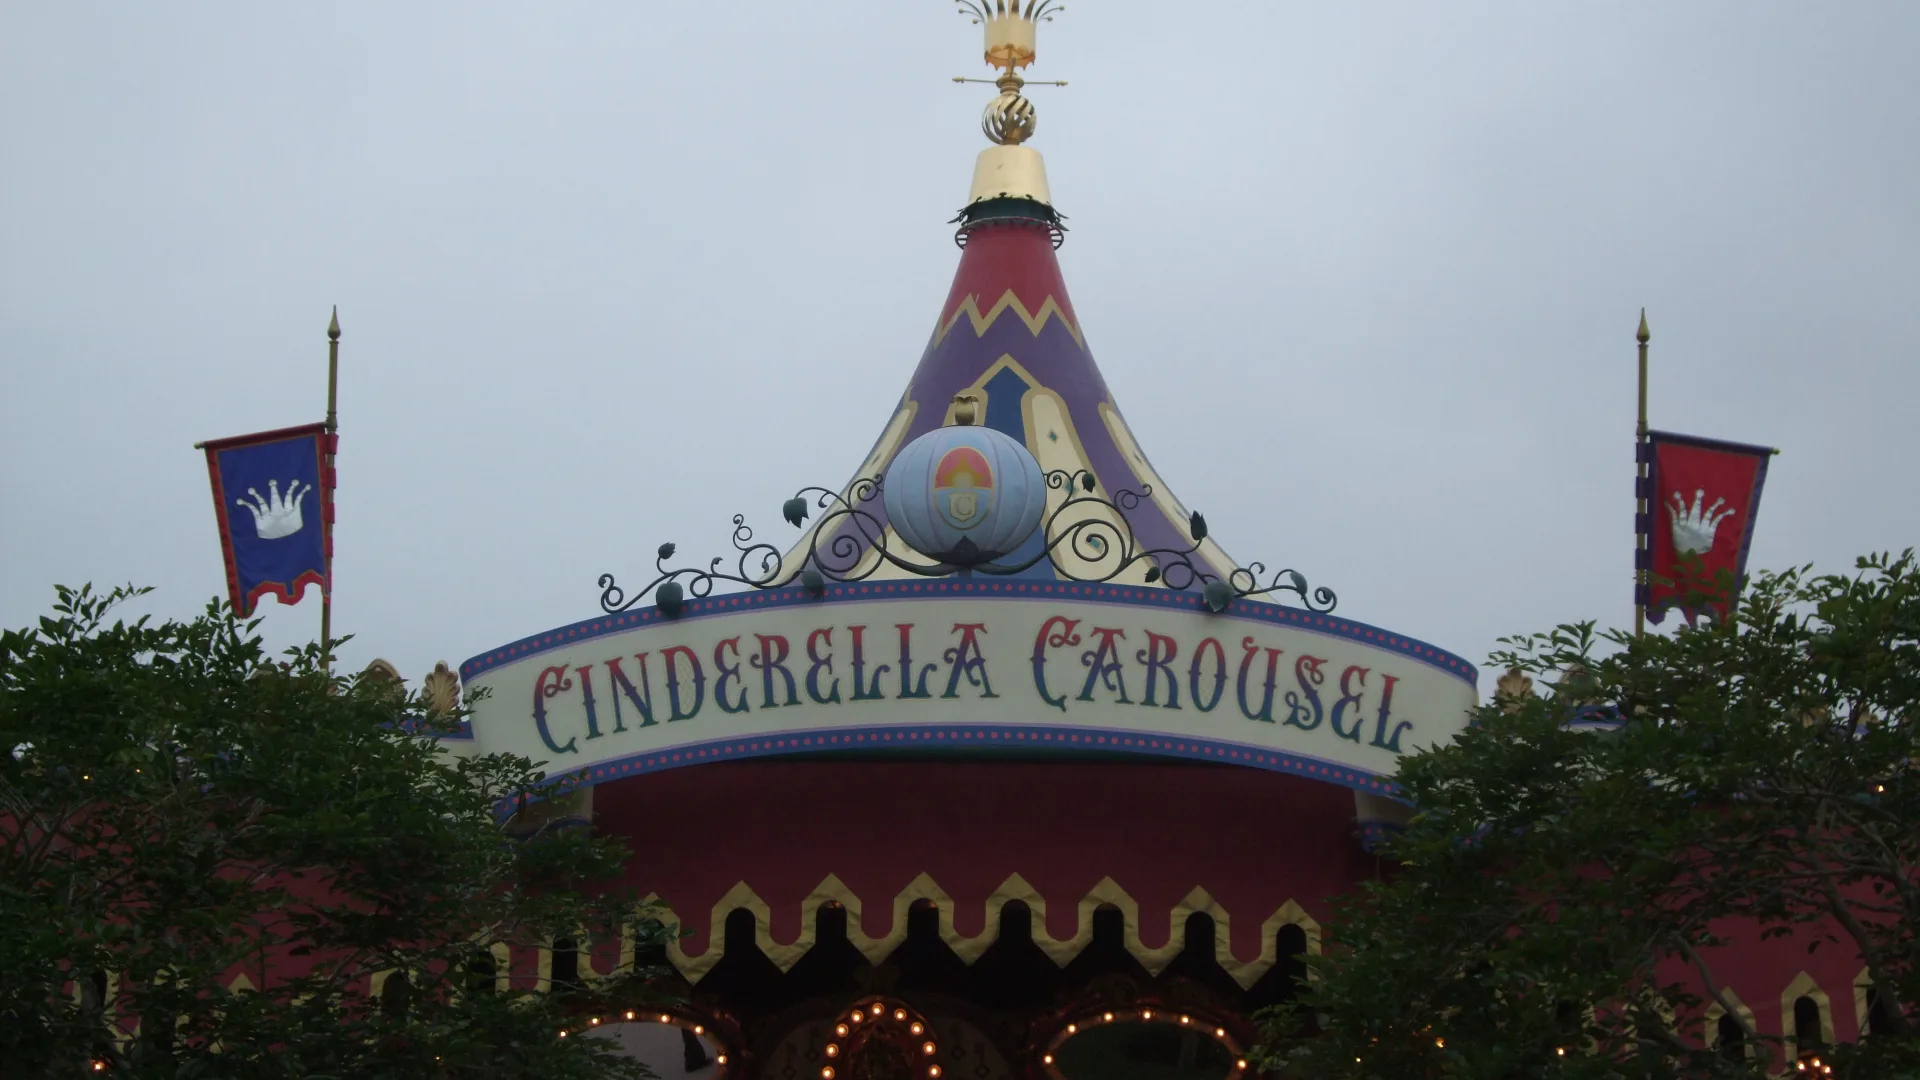
Cinderella Carousel

Sierlijke Fantasyland-carrousel met witte paarden, chariots en Cinderella-taferelen.

Cinderella Carousel is een klassieke Disney-carrousel in het hart van Fantasyland. Je kiest een van de witte paarden of een chariot en draait op rustige muziek rond onder een middeleeuws ogende kap. De rit is laag in intensiteit, maar rijk in aankleding: handgeschilderde Cinderella-scenes, zachte kleuren en duizenden lampjes maken hem vooral een ontspannen familierit en fotomoment.

Normal 5 min
Average 6 min
Highest measurement 25 min Measured at 30-07 18:37
Type Ride
Category Carousel
Photos
RCDB

Coaster profile

Classification

Scale low
Official height rule Any Height
Official area Fantasyland
Horse count 60 wood-carved white steeds
Chariot count 2
Painted vignettes 8 Cinderella scenes
Light count 3,328 shimmering lights

Location

Fantasyland, Hong Kong Disneyland Park.

Notes

Cinderella Carousel opende met Hong Kong Disneyland op 12 september 2005.

Theming

De carrousel is geinspireerd op Disney's Cinderella, met 8 handgeschilderde vignetten op de binnenrand boven de paarden.

Data

Wait statistics

Based on available measurements and historical wait-time data.

Now 5 min
Normal 5 min
Average 6 min
Highest measurement 25 min Measured at 30-07 18:37
Measurements 1998
Outage measurements 8
Avg. outage duration 24 min
Often busy 20:00 10 min average
Often quiet 10:00 5 min average
Reliability High 2089 measurements, 11 hour blocks
Distribution

Boxplots

Spread of wait times, outage duration, and the number of outages per day based on available historical data.

Wait times

1998 measurements

0 min 10 min 20 min 30 min
Min
5 min
Q1
5 min
Median
5 min
Q3
5 min
Max
25 min

Typical wait time: around 5 min.

It usually falls between 5 min and 5 min.

See more than 5 min? It is probably busier than usual — consider a quieter moment.

Less than 5 min? You are in luck: that does not happen often.

Outage duration

2 outages

0 min 15 min 30 min 45 min
Min
5 min
Q1
14 min
Median
24 min
Q3
33 min
Max
42 min

On average, an outage lasts about 24 min.

In three out of four cases, the attraction reopens within 33 min.

If it takes longer, expect extra waiting time.

Outages per day

1 day

0 1 2
Min
2
Q1
2
Median
2
Q3
2
Max
2

On days with outages, we see an average of 2 per day.

That usually falls between 2 and 2.

On quiet days it was 2, on busy days up to 2.

Historical

Wait-time build-up

Today compared with historical wait times by hour.

Today Expected Historical
Horizontal axis hours, vertical axis queue minutes. 0 min 5 min 10 min 15 min 20 min 10:00 12:00 14:00 16:00 18:00 20:00