

← Back to Hong Kong Disneyland Park
Ride details

Ant-Man and The Wasp: Nano Battle!

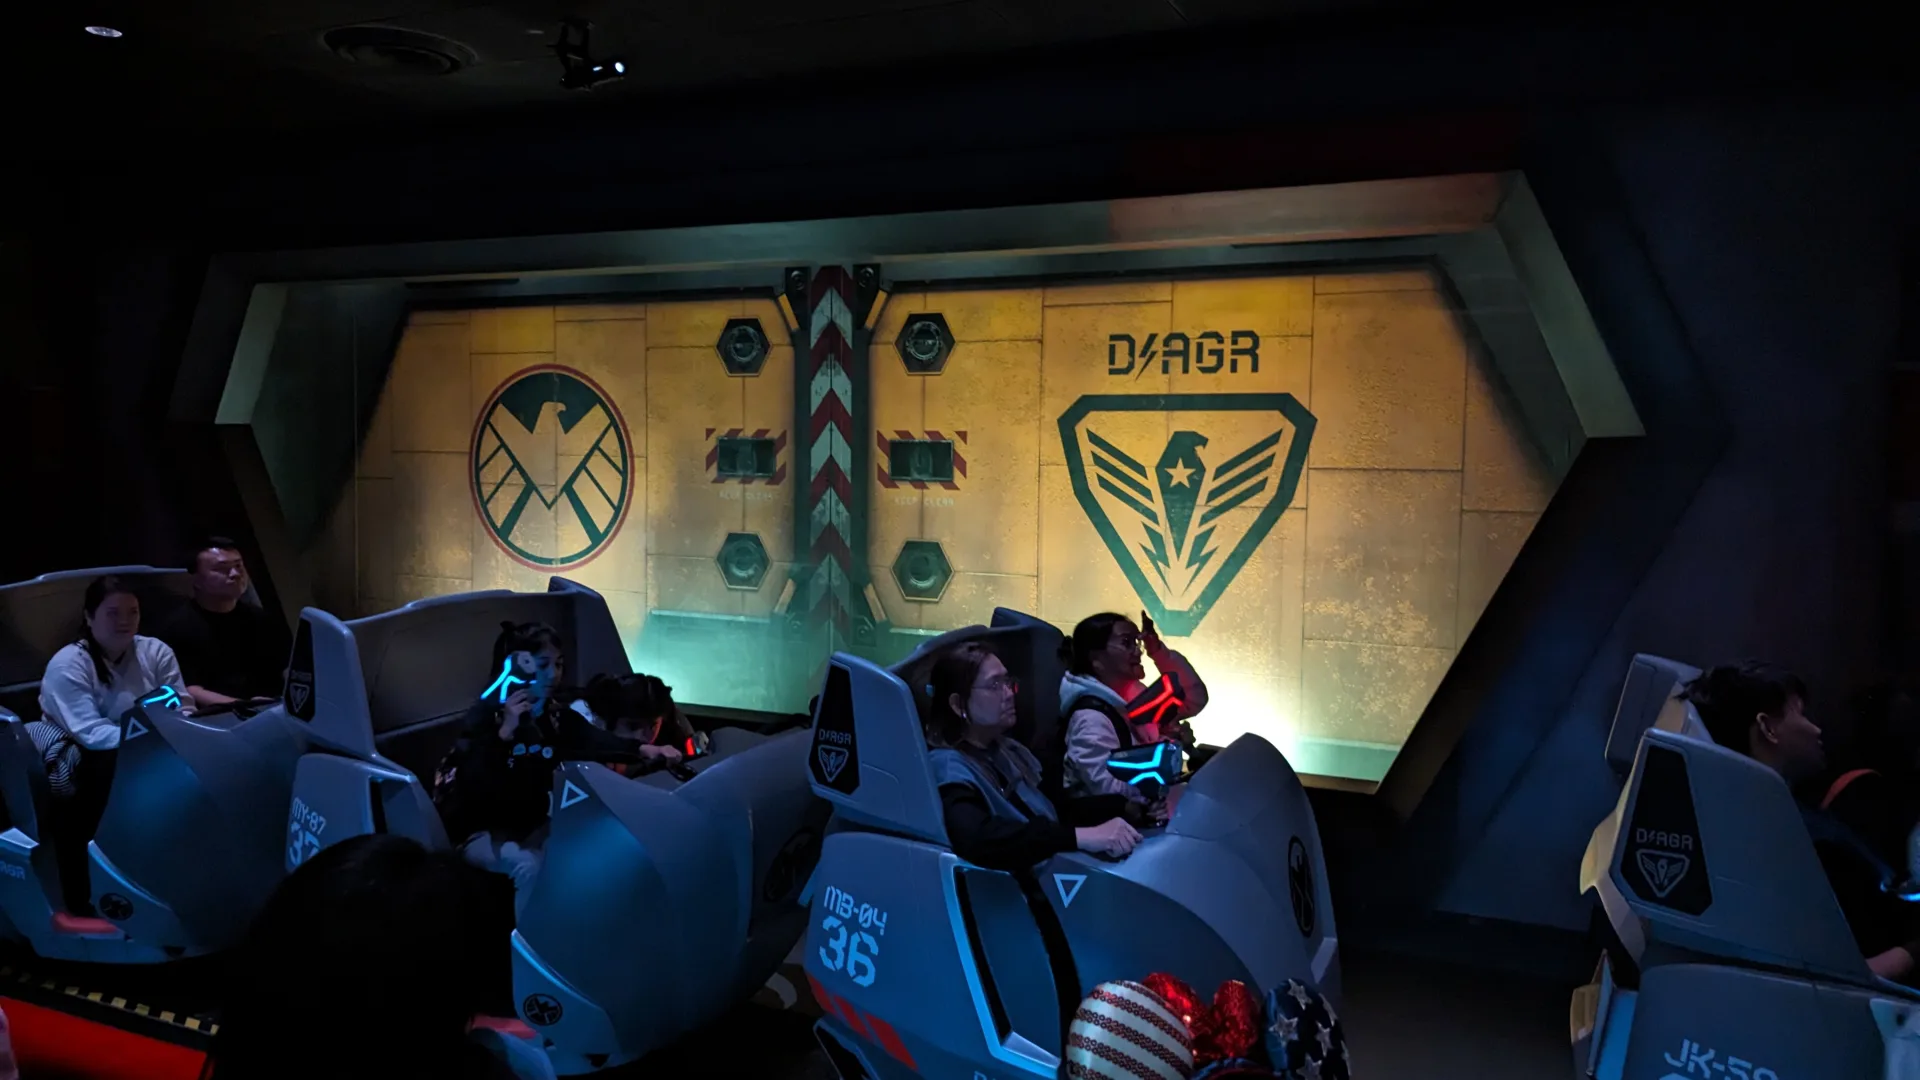
Ant-Man and The Wasp: Nano Battle! is een interactieve Marvel-darkride waarin je met EMP-blasters tegen Hydra-swarmbots vecht.

Ant-Man and The Wasp: Nano Battle! speelt zich af in het S.H.I.E.L.D. Science & Technology Pavilion binnen Stark Expo. Terwijl Iron Man elders Hydra tegenhoudt, stappen bezoekers in een Dagger-voertuig en richten ze EMP-blasters op swarmbots die de Data Core proberen te stelen. De rit is laagdrempelig dankzij de Any Height-regel, maar het schietspel maakt hem actief en competitief.

Normal 5 min
Average 8 min
Highest measurement 35 min Measured at 31-07 14:01
Type Ride
Category Dark Ride
Photos
RCDB

Coaster profile

Classification

Scale family
Official height rule Any Height
Vehicle type Omnimover
Riders per vehicle 3
Interactive system EMP Blaster shooting gameplay
Previous attraction Buzz Lightyear Astro Blasters

Tracks

Ride duration 4:09

Trains

Capacity per hour 1,670

Notes

De officiële parkpagina vermeldt Tomorrowland, Any Height en het verhaal rond S.H.I.E.L.D., Hydra, Swarmbots en de Data Core. Wikipedia vermeldt opening op 31 maart 2019, Sansei Yusoki als fabrikant, Walt Disney Imagineering als designer, Omnimover-voertuigen en 4:09 ritduur.

Theming

Het thema gebruikt Stark Expo, S.H.I.E.L.D.-technologie, Ant-Man, The Wasp, Hydra en Arnim Zola als basis voor een interactieve nano-schaal missie.

Data

Wait statistics

Based on available measurements and historical wait-time data.

Now 5 min
Normal 5 min
Average 8 min
Highest measurement 35 min Measured at 31-07 14:01
Measurements 1649
Outage measurements 122
Avg. outage duration 183 min
Often busy 14:00 10 min average
Often quiet 10:00 5 min average
Reliability High 1729 measurements, 11 hour blocks
Distribution

Boxplots

Spread of wait times, outage duration, and the number of outages per day based on available historical data.

Wait times

1649 measurements

0 min 10 min 20 min 30 min 40 min
Min
5 min
Q1
5 min
Median
5 min
Q3
10 min
Max
35 min

Typical wait time: around 5 min.

It usually falls between 5 min and 10 min.

See more than 10 min? It is probably busier than usual — consider a quieter moment.

Less than 5 min? You are in luck: that does not happen often.

Outage duration

5 outages

0 min 4 min 8 min 12 min 16 min
Min
6 min
Q1
6 min
Median
15 min
Q3
15 min
Max
16 min

On average, an outage lasts about 15 min.

In three out of four cases, the attraction reopens within 15 min.

If it takes longer, expect extra waiting time.

Outages per day

4 days

0 1 2
Min
2
Q1
2
Median
2
Q3
2
Max
2

On days with outages, we see an average of 2 per day.

That usually falls between 2 and 2.

On quiet days it was 2, on busy days up to 2.

Historical

Wait-time build-up

Today compared with historical wait times by hour.

Today Expected Historical
Horizontal axis hours, vertical axis queue minutes. 0 min 5 min 10 min 15 min 20 min 10:00 12:00 14:00 16:00 18:00 20:00