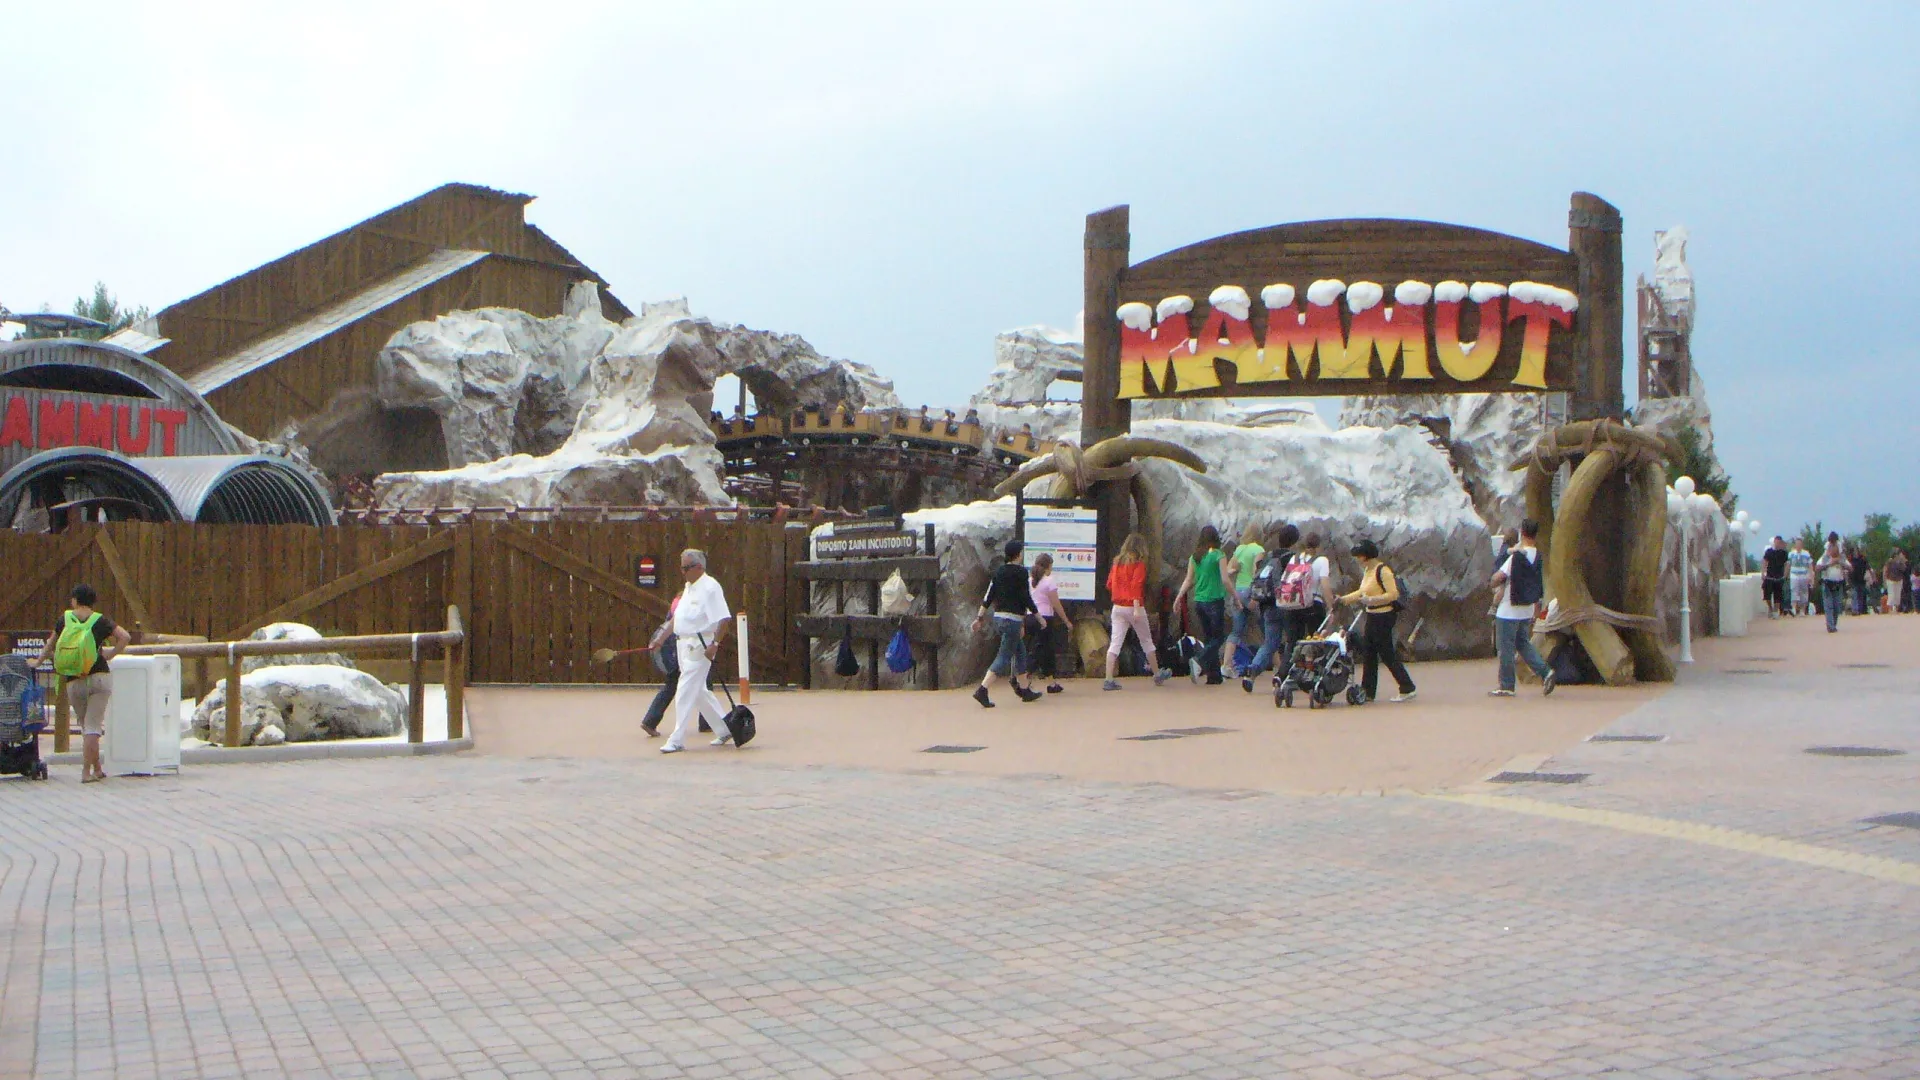
Photo 1 of Mammut
← Back to Gardaland Gardaland park info Opening hours Gardaland
Ride details

Mammut

Een Vekoma mine train met drie lifthills, arctisch thema en een lange familievriendelijke baan.

Mammut is Gardalands grote poolavontuur op rails. De baan gebruikt meerdere lifthills om de trein steeds opnieuw momentum te geven, terwijl de expeditiethematiek en rotsformaties het gevoel van een arctische tocht oproepen. Hij is toegankelijker dan de extreme coasters, maar door lengte en ritritme toch duidelijk meer dan een kinderachtbaan.

Normal 5 min
Average 23 min
Highest measurement 155 min Measured at 31-10 16:49
Type Ride
Category Roller coaster
Photos
RCDB

Coaster profile

View on RCDB

Classification

RCDB #3689
RCDB status Operating since March 19, 2008
Classification Roller Coaster
Track type Steel
Design Sit Down
Scale Thrill
Layout Sit Down
Categories Roller Coaster, Steel, Sit Down, Thrill
Installer RCS GmbH

Tracks

Length 3,264.4 ft (995.0 m)
Height 45.9 ft (14.0 m)
Speed 31.1 mph (50.1 km/h)
Inversions 0
Ride duration 2:45

Trains

Arrangement 3 treinen met 6 wagens per trein; passagiers zitten 2 naast elkaar in 3 rijen, samen 36 passagiers per trein.
Trains 3
Cars per train 6
Rows per car 3
Riders per row 2
Riders per train 36

Location

Adventure

Notes

RCDB vermeldt 3264,4 ft baanlengte, 45,9 ft hoogte, 31,1 mph, 0 inversies en 2:45 ritduur. De drie lifthills zijn respectievelijk 39,3 ft, 42,7 ft en 45,9 ft hoog; Stefan Holtman staat bij RCDB als designer en RCS GmbH als installer.

Theming

Arctisch expeditiethema rond een legendarische Mammut-convooi, met rotsen, koudecor en avontuurlijke mijntraintoon.


Data

Wait statistics

Based on available measurements and historical wait-time data.

Now Closed
Normal 5 min
Average 23 min
Highest measurement 155 min Measured at 31-10 16:49
Measurements 2610
Outage measurements 0
Avg. outage duration -
Often busy 23:00 50 min average
Often quiet 10:00 5 min average
Reliability High 5689 measurements, 14 hour blocks
Distribution

Boxplots

Spread of wait times, outage duration, and the number of outages per day based on available historical data.

Wait times

2610 measurements

0 min 40 min 80 min 120 min 160 min
Min
0 min
Q1
10 min
Median
20 min
Q3
34 min
Max
155 min

Typical wait time: around 20 min.

It usually falls between 10 min and 34 min.

See more than 34 min? It is probably busier than usual — consider a quieter moment.

Less than 10 min? You are in luck: that does not happen often.

Outage duration

Not enough data yet for a boxplot.

This attraction has not reported any outages to us yet. We cannot say anything meaningful about it here.

Outages per day

Not enough data yet for a boxplot.

This attraction has not reported any outages to us yet. We cannot say anything meaningful about it here.

Historical

Wait-time build-up

Today compared with historical wait times by hour.

Today Expected Historical
Horizontal axis hours, vertical axis queue minutes. 0 min 15 min 30 min 45 min 60 min 08:00 10:00 12:00 14:00 16:00 18:00 20:00 22:00 23:00