

← Back to Gardaland
Ride details

Fuga da Atlantide

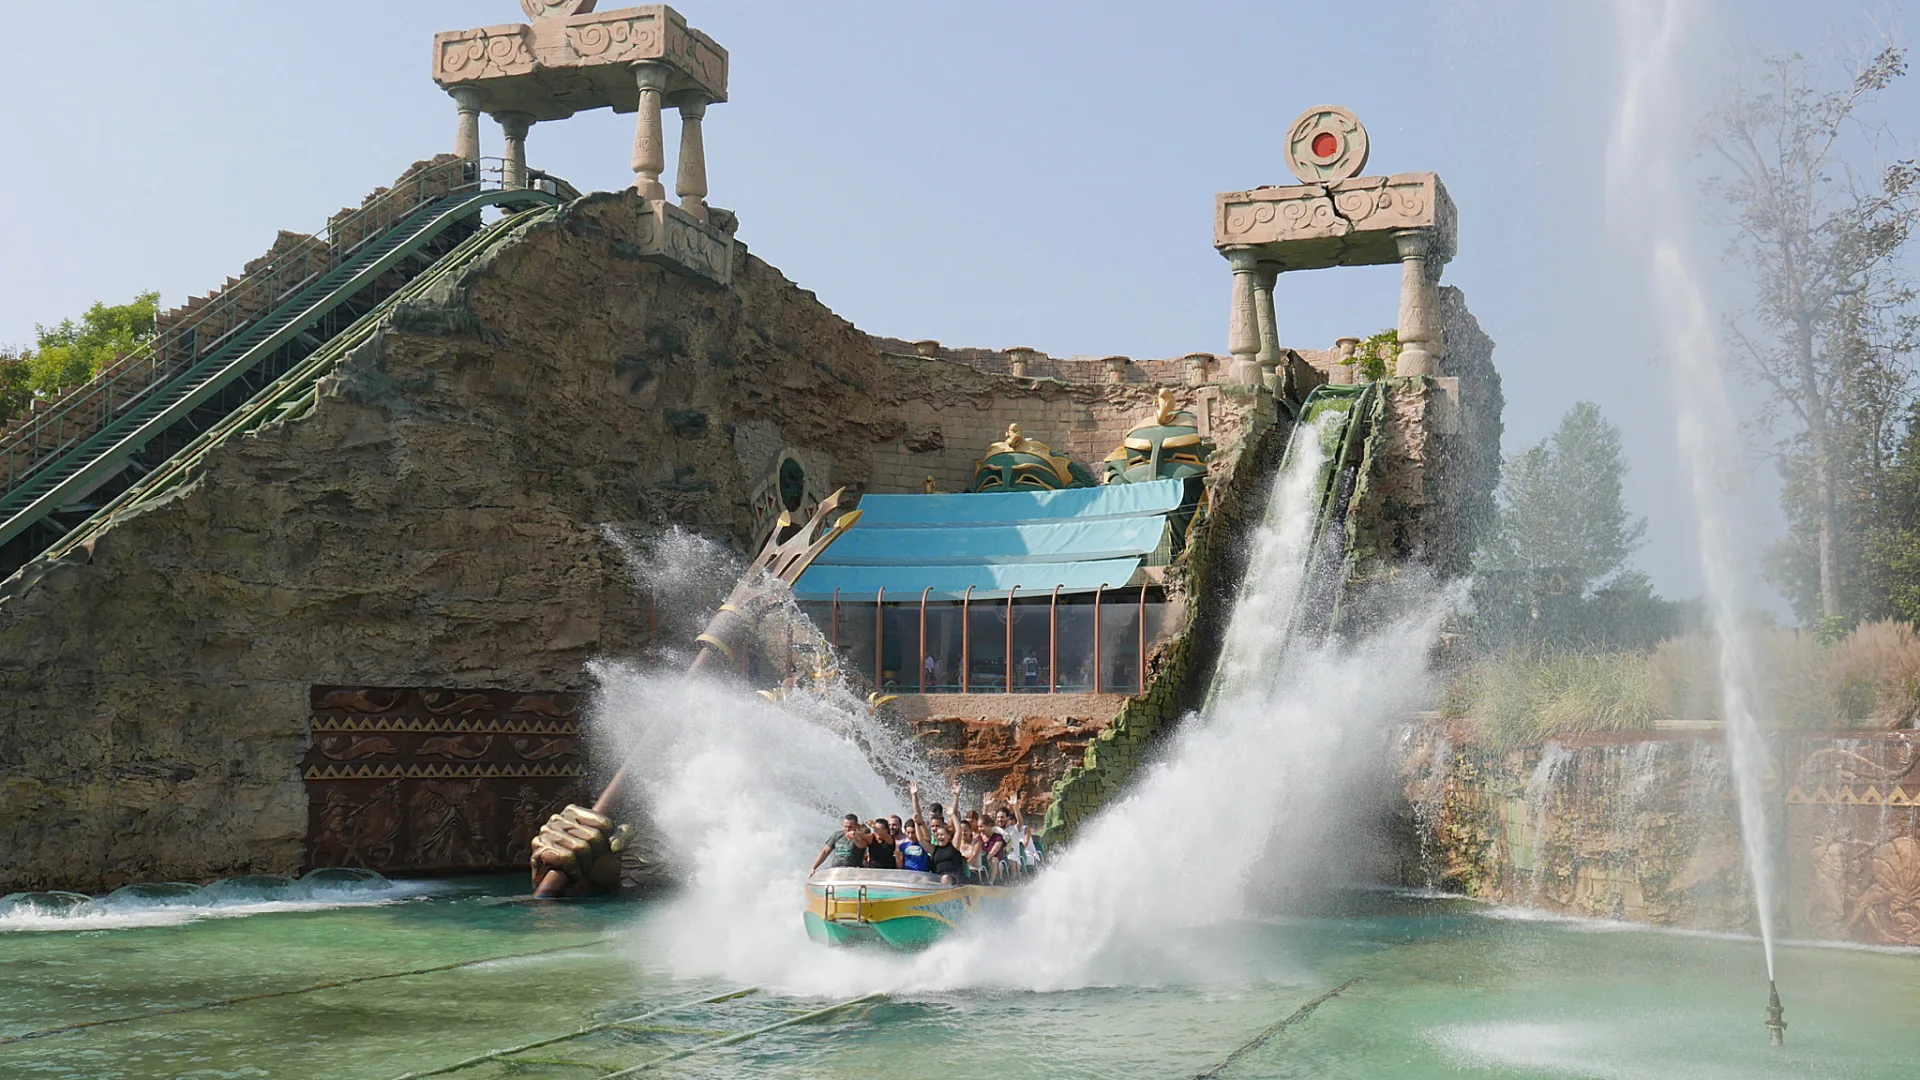
Groots gethematiseerde waterbaan rond Atlantis, met grote boten, liften en twee stevige splash-afdalingen.

Fuga da Atlantide is een van de markantste waterattracties van Gardaland. De grote boten voeren langs tempels, poorten en Atlantische ruines voordat de rit twee keer naar een spectaculaire afdaling toewerkt. Door de combinatie van brede boten, hoge themadecoratie en fors opspattend water voelt de attractie groots, maar blijft hij geschikt voor gezinnen die de minimumlengte halen.

Normal 10 min
Average 13 min
Highest measurement 45 min Measured at 20-06 11:31
Type Ride
Category Water Ride
Photos
RCDB

Coaster profile

Classification

Scale family_thrill
Official type Atlantis themed water ride
Official area Adventure
Minimum height 110 cm
Maximum height 195 cm
Main drops 39.4 ft (12.0 m) and 55.8 ft (17.0 m)
Manufacturer Intamin
Model Super Splash
Opening year 2003
Maximum speed 46.6 mi (75.0 km)/h
Riders per boat 20
Track length Conflicting published values; not normalized
Primary source Gardaland official ride page

Tracks

Speed 46.6 mph (75.0 km/h)

Trains

Arrangement 20 riders per boat

Notes

Gardaland noemt twee duiken vanaf 12 en 17 meter en een lengteband van 110 tot 195 cm. Intamin/attractiedatabases ondersteunen het Super Splash-profiel, 20 personen per boot en 75 km/u; bronnen verschillen over baanlengte, daarom is die niet als kernveld ingevuld.

Theming

Het thema draait om de verloren beschaving Atlantis, met tempels, poorten, bogen en de dreiging van Neptunus als verhaallijn rond de twee afdalingen.

Data

Wait statistics

Based on available measurements and historical wait-time data.

Now Closed
Normal 10 min
Average 13 min
Highest measurement 45 min Measured at 20-06 11:31
Measurements 1974
Outage measurements 0
Avg. outage duration -
Often busy 11:00 25 min average
Often quiet 22:00 0 min average
Reliability High 2065 measurements, 13 hour blocks
Distribution

Boxplots

Spread of wait times, outage duration, and the number of outages per day based on available historical data.

Wait times

1974 measurements

0 min 15 min 30 min 45 min
Min
0 min
Q1
5 min
Median
10 min
Q3
20 min
Max
45 min

Typical wait time: around 10 min.

It usually falls between 5 min and 20 min.

See more than 20 min? It is probably busier than usual — consider a quieter moment.

Less than 5 min? You are in luck: that does not happen often.

Outage duration

Not enough data yet for a boxplot.

This attraction has not reported any outages to us yet. We cannot say anything meaningful about it here.

Outages per day

Not enough data yet for a boxplot.

This attraction has not reported any outages to us yet. We cannot say anything meaningful about it here.

Historical

Wait-time build-up

Today compared with historical wait times by hour.

Today Expected Historical
Horizontal axis hours, vertical axis queue minutes. 0 min 10 min 20 min 30 min 10:00 12:00 14:00 16:00 18:00 20:00 22:00 23:00