

← Back to Europa-Park
Ride details

ARTHUR

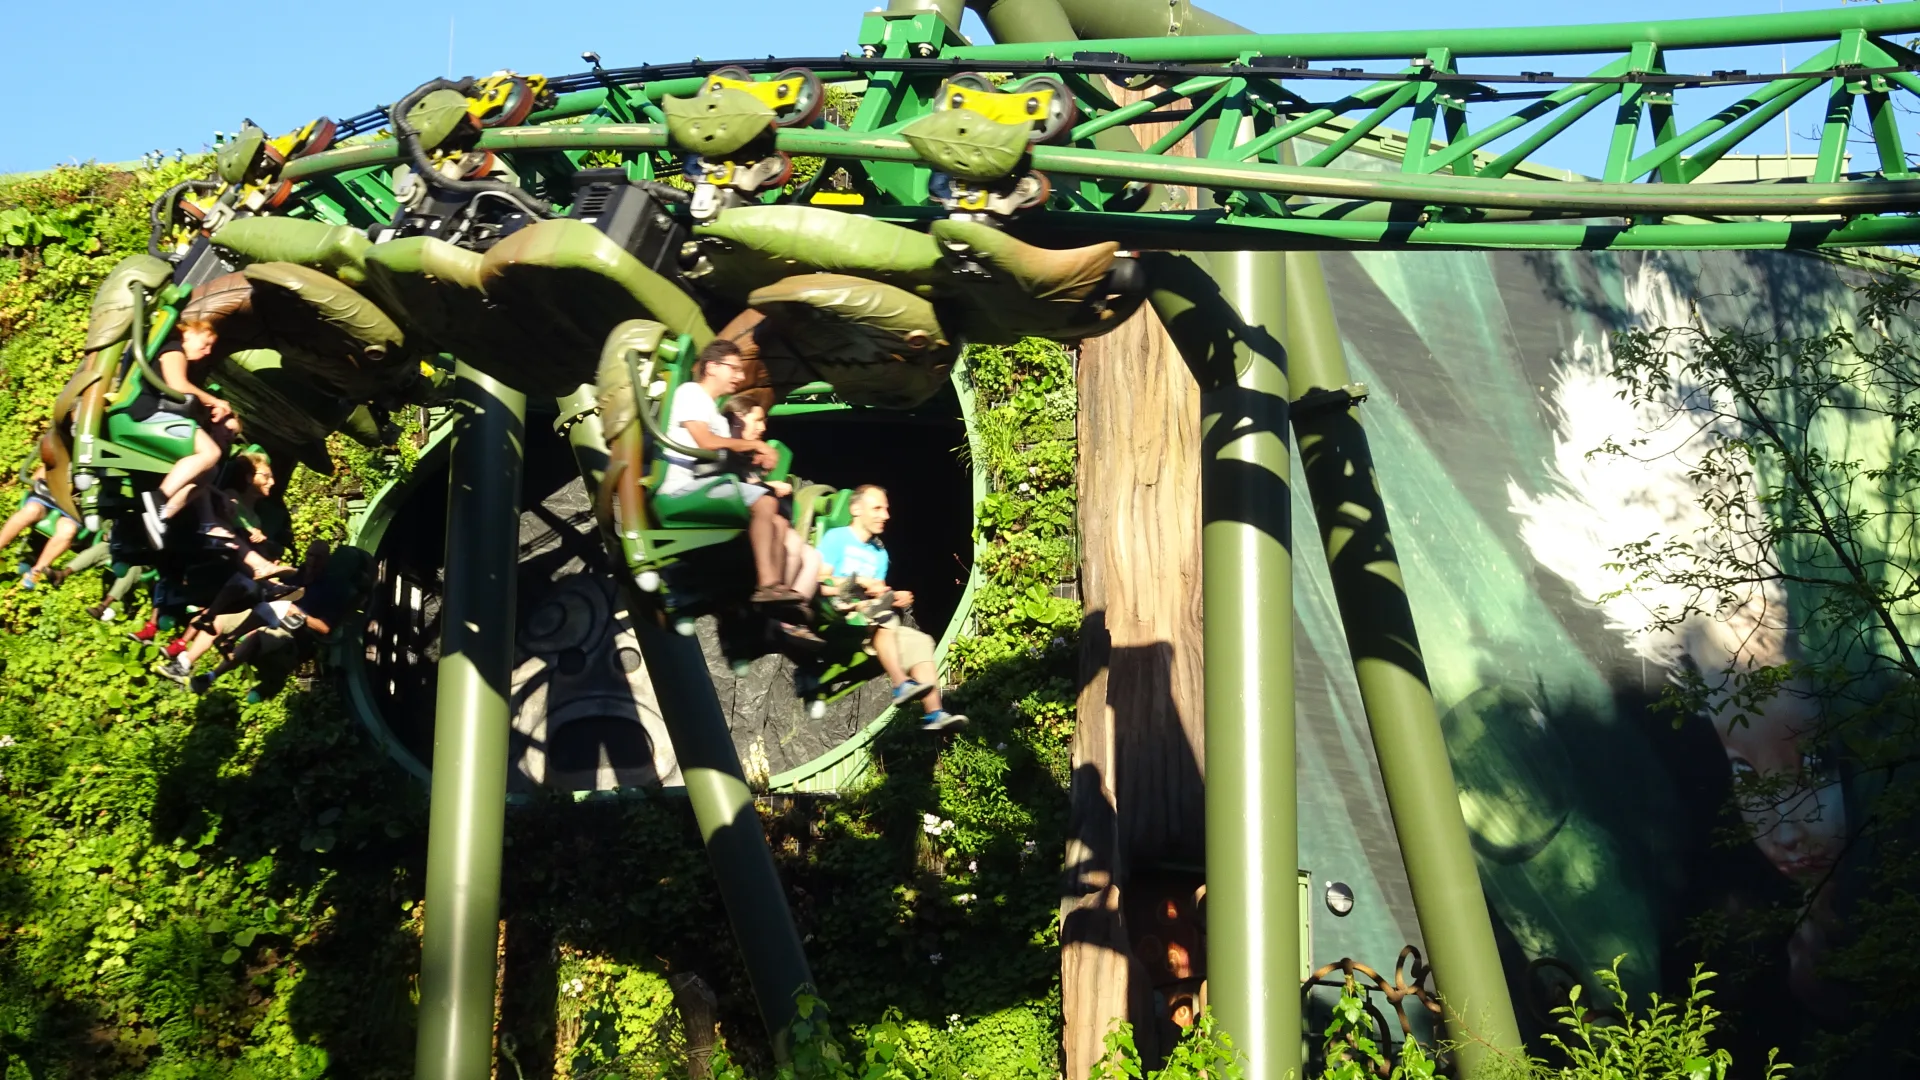
Een hangende powered family coaster door het rijk van de Minimoys, met draaiende wagens en darkride-scenes.

ARTHUR is meer dan een gewone familieachtbaan: de trein hangt onder de baan, de wagens kunnen draaien en de rit wisselt buitenpassages af met uitgebreide show- en darkridegedeeltes. Het resultaat voelt als een filmische reis door The Minimoys Kingdom, waarin achtbaantechniek en decorbouw elkaar voortdurend aflossen.

Normal 25 min
Average 25 min
Highest measurement 150 min Measured at 26-04 12:47
Type Ride
Category Roller coaster
Photos
RCDB

Coaster profile

View on RCDB

Classification

RCDB #11114
RCDB status Operating since July 1, 2014
Classification Powered Coaster
Track type Steel
Design Powered Coaster
Scale Family
Layout Inverted
Station Conveyor Station
Categories Powered Coaster, Steel, Inverted, Family
Official opening 2014
Official minimum accompanied 100 cm
Official minimum unaccompanied 120 cm
Official age 4+ years; under 6 years with adult
Theme P&P Projects; Atelier Artistique du Béton; Heimotion GmbH
Based on Arthur & The Minimoys

Tracks

Length 1,656.8 ft (505.0 m)
Height 44.3 ft (13.5 m)
Speed 19.3 mph (31.1 km/h)
Inversions 0
Ride duration 4:30

Trains

Arrangement 8 treinen met 3 wagens per trein; 4 zitplaatsen naast elkaar op 1 rij per wagen
Trains 8
Cars per train 3
Rows per car 1
Riders per row 4
Riders per train 12
Capacity per hour 1,500

Location

The Minimoys Kingdom

Notes

Officiële opening: 2014. Officiële theoretische capaciteit: 1100 personen per uur; RCDB vermeldt 1500 personen per uur. RCDB noemt P&P Projects, Atelier Artistique du Béton en Heimotion GmbH bij de thematisering.

Theming

Gebaseerd op Arthur en de Minimoys, met meerdere dark/show-secties, onboard audio, geuren, rook/mist, lichteffecten en verrassingsmomenten.

Data

Wait statistics

Based on available measurements and historical wait-time data.

Now Closed
Normal 25 min
Average 25 min
Highest measurement 150 min Measured at 26-04 12:47
Measurements 165076
Outage measurements 133
Avg. outage duration 23 min
Often busy 16:00 30 min average
Often quiet 09:00 20 min average
Reliability High 4750 measurements, 9 hour blocks
Distribution

Boxplots

Spread of wait times, outage duration, and the number of outages per day based on available historical data.

Wait times

165076 measurements

0 min 40 min 80 min 120 min 160 min
Min
0 min
Q1
15 min
Median
25 min
Q3
35 min
Max
150 min

Typical wait time: around 25 min.

It usually falls between 15 min and 35 min.

See more than 35 min? It is probably busier than usual — consider a quieter moment.

Less than 15 min? You are in luck: that does not happen often.

Outage duration

34 outages

0 min 25 min 50 min 75 min 100 min
Min
5 min
Q1
5 min
Median
6 min
Q3
29 min
Max
93 min

Outages usually last about 6 min.

Some are over quickly (sometimes within 5 min), others take longer (up to 29 min). That varies per outage.

Already longer than 29 min? The attraction may stay closed a while longer.

Outages per day

16 days

0 1 2 3 4
Min
1
Q1
2
Median
2
Q3
2
Max
4

On days with outages, we see an average of 2 per day.

That usually falls between 2 and 2.

On quiet days it was 1, on busy days up to 4.

Historical

Wait-time build-up

Today compared with historical wait times by hour.

Today Expected Historical
Horizontal axis hours, vertical axis queue minutes. 0 min 10 min 20 min 30 min 09:00 11:00 13:00 15:00 17:00 18:00