

← Back to EPCOT
Ride details

Living with the Land

Een rustige boottocht door ecosystemen en Disney's kassen over landbouw, voedsel en innovatie.

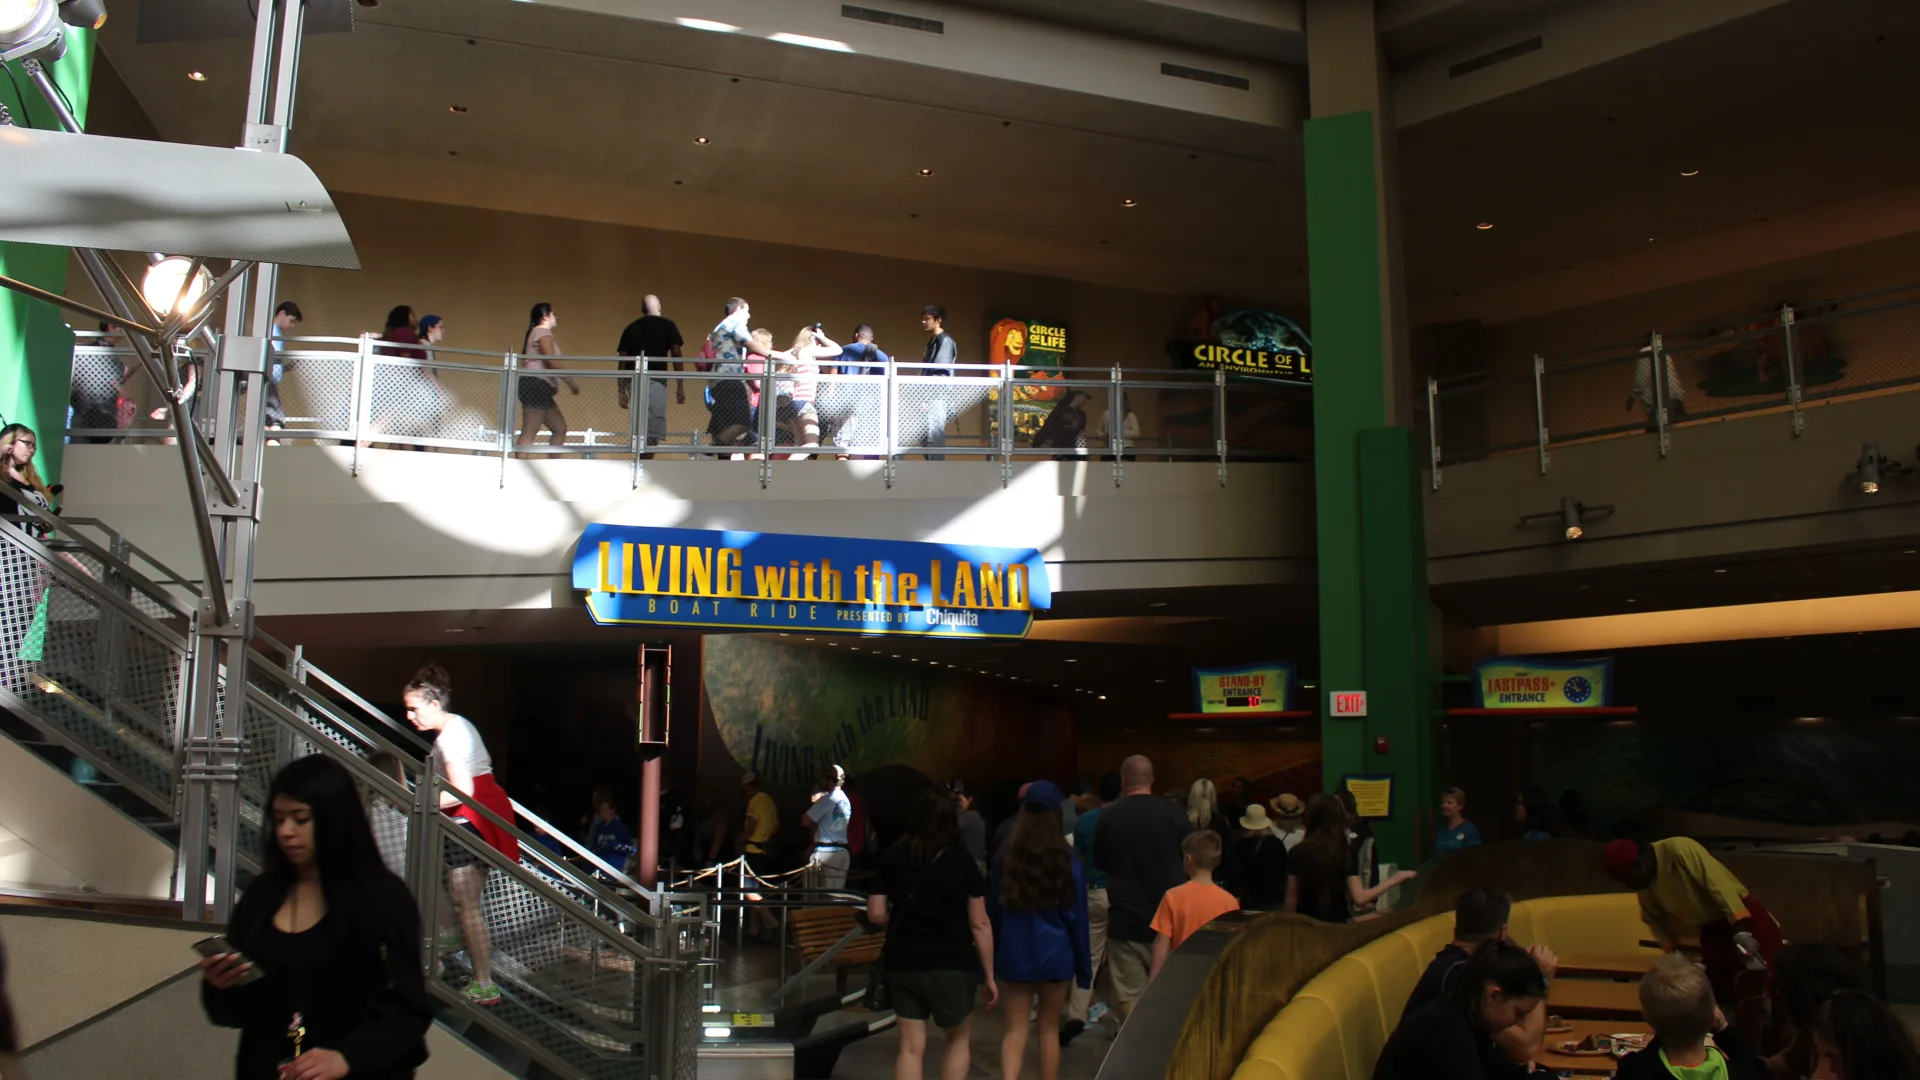
Living with the Land is een kalme educatieve boottocht in World Nature. De route begint met scenes over natuur en landbouw en vaart daarna langs echte kassen, teelttechnieken en viskweek, waardoor de attractie EPCOTs optimistische blik op voedsel en innovatie mooi samenvat.

Normal 10 min
Average 11 min
Highest measurement 55 min Measured at 30-06 15:03
Type Ride
Category Boat ride
Photos
RCDB

Coaster profile

Classification

Scale low

Tracks

Ride duration 14:55

Trains

Capacity per hour 1,600

Notes

Opening-day EPCOT-rit met een rustige bootroute langs biomen, aquacultuur en kassen. De attractie werkt goed als kalme pauze in The Land Pavilion, maar bevat tegelijk veel praktische Disney-landbouw en kasexperimenten om naar te kijken.

Theming

World Nature-thema rond landbouwgeschiedenis, ecosystemen, kassen, duurzame teelt, hydroponics en aquacultuur.

Data

Wait statistics

Based on available measurements and historical wait-time data.

Now Closed
Normal 10 min
Average 11 min
Highest measurement 55 min Measured at 30-06 15:03
Measurements 6085
Outage measurements 201
Avg. outage duration 21 min
Often busy 11:00 20 min average
Often quiet 09:00 5 min average
Reliability High 6060 measurements, 12 hour blocks
Distribution

Boxplots

Spread of wait times, outage duration, and the number of outages per day based on available historical data.

Wait times

6085 measurements

0 min 15 min 30 min 45 min 60 min
Min
5 min
Q1
5 min
Median
5 min
Q3
15 min
Max
55 min

Typical wait time: around 5 min.

It usually falls between 5 min and 15 min.

See more than 15 min? It is probably busier than usual — consider a quieter moment.

Less than 5 min? You are in luck: that does not happen often.

Outage duration

53 outages

0 min 30 min 60 min 90 min 120 min
Min
1 min
Q1
5 min
Median
6 min
Q3
15 min
Max
109 min

On average, an outage lasts about 6 min.

In three out of four cases, the attraction reopens within 15 min.

If it takes longer, expect extra waiting time.

Outages per day

17 days

0 3 6 9
Min
1
Q1
2
Median
2
Q3
3
Max
9

On days with outages, we see an average of 2 per day.

That usually falls between 2 and 3.

On quiet days it was 1, on busy days up to 9.

Historical

Wait-time build-up

Today compared with historical wait times by hour.

Today Historical
Horizontal axis hours, vertical axis queue minutes. 0 min 10 min 20 min 30 min 09:00 11:00 13:00 15:00 17:00 19:00 21:00