

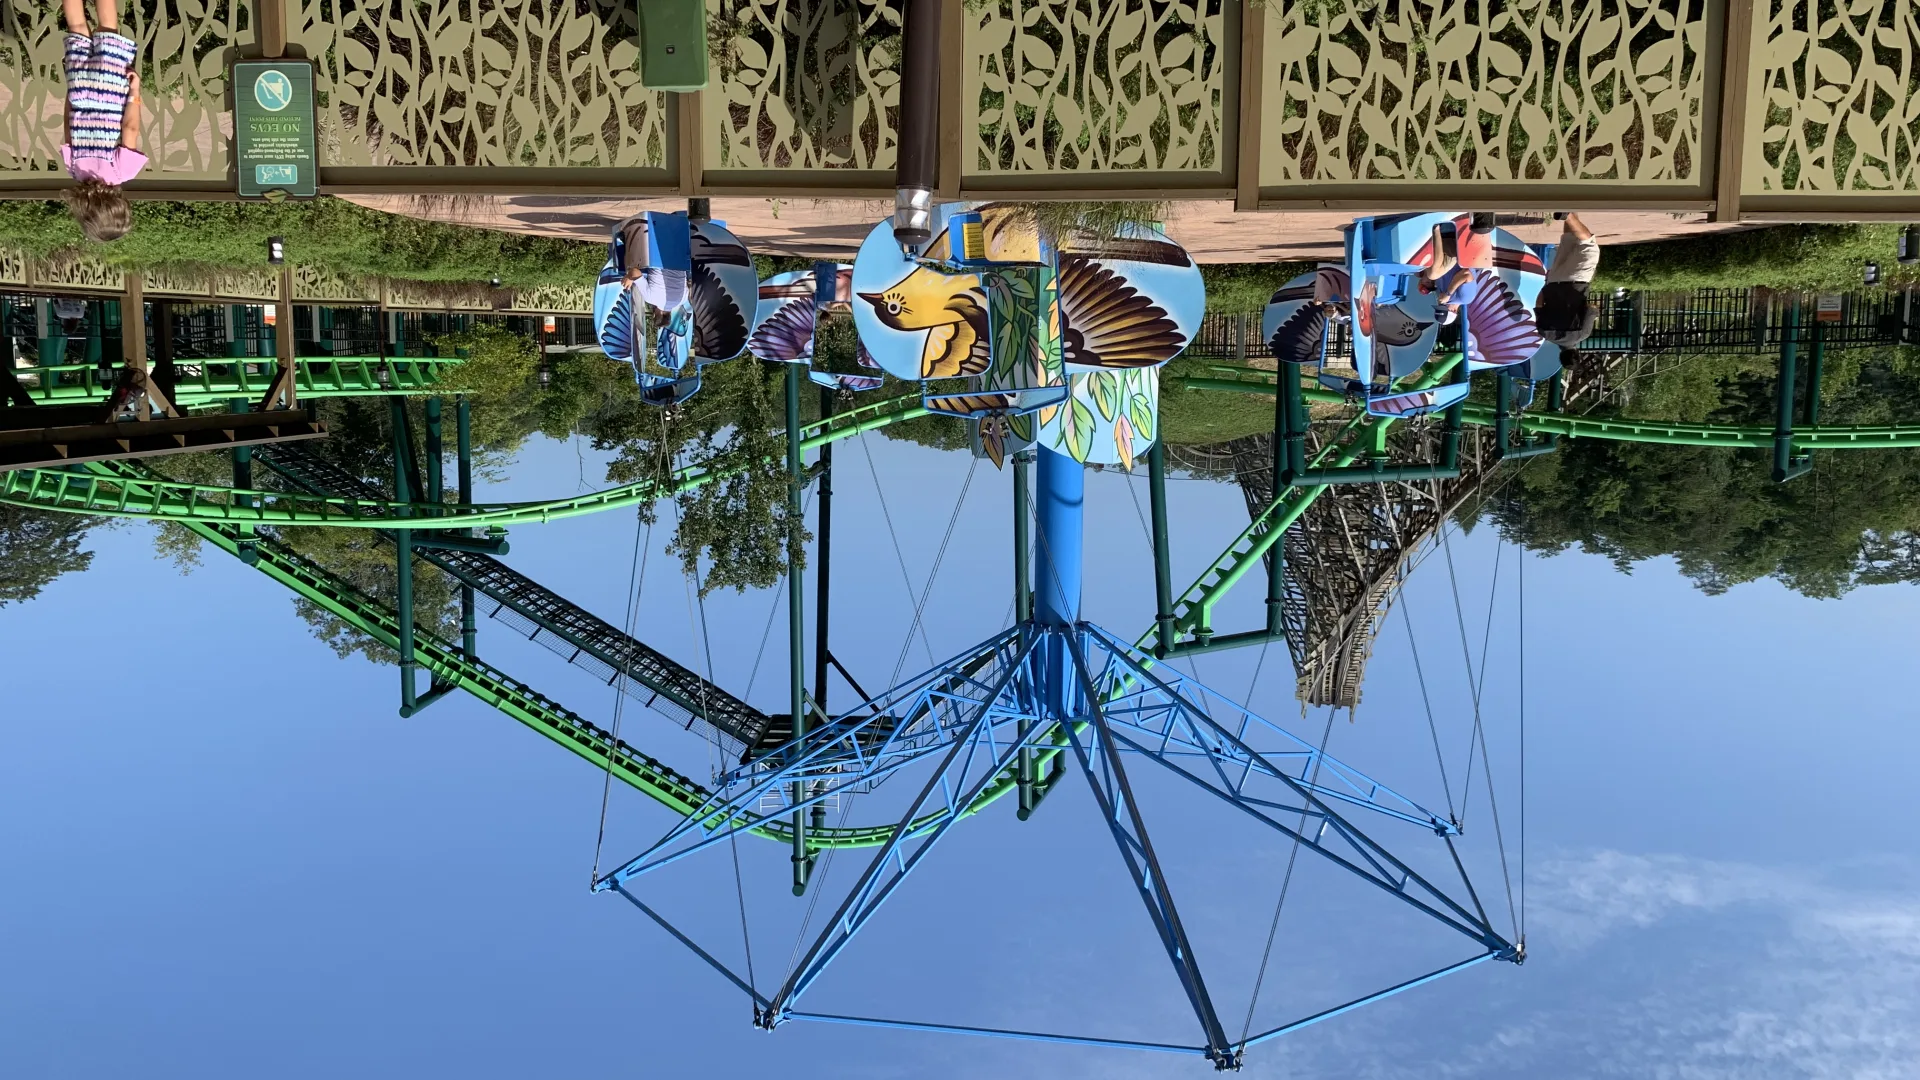
Photo 1 of The Mad Mockingbird
← Back to Dollywood
Ride details

The Mad Mockingbird

Een speelse vliegtocht waarin spotlijster-voertuigen rondzwaaien en steeds verder naar buiten kantelen.

The Mad Mockingbird is een familierit in Wildwood Grove waarbij de voertuigen als vrolijke bosvogels rond de centrale as bewegen. Tijdens de rit zwaaien ze omhoog en naar buiten, waardoor de beweging voelt als een lichte vlucht boven het themagebied.

Normal 8 min
Average 9 min
Highest measurement 35 min Measured at 01-07 11:27
Type Ride
Category Spinning Ride
Photos
RCDB

Coaster profile

Classification

Design Swing-out bird ride vehicles
Scale family_thrill
Restraints Seat belt

Location

Wildwood Grove

Notes

Geschikt voor families die een draaiende rit zoeken met duidelijke zijwaartse beweging maar zonder grote hoogte of achtbaanintensiteit.

Theming

De attractie sluit aan op de natuurwereld van Wildwood Grove en gebruikt spotlijsters als herkenbaar speels motief.

Data

Wait statistics

Based on available measurements and historical wait-time data.

Now Closed
Normal 8 min
Average 9 min
Highest measurement 35 min Measured at 01-07 11:27
Measurements 4632
Outage measurements 612
Avg. outage duration 39 min
Often busy 11:00 10 min average
Often quiet 09:00 5 min average
Reliability High 5295 measurements, 13 hour blocks
Distribution

Boxplots

Spread of wait times, outage duration, and the number of outages per day based on available historical data.

Wait times

4632 measurements

0 min 10 min 20 min 30 min 40 min
Min
5 min
Q1
5 min
Median
10 min
Q3
10 min
Max
35 min

Typical wait time: around 10 min.

It usually falls between 5 min and 10 min.

See more than 10 min? It is probably busier than usual — consider a quieter moment.

Less than 5 min? You are in luck: that does not happen often.

Outage duration

105 outages

0 min 100 min 200 min 300 min
Min
1 min
Q1
5 min
Median
20 min
Q3
62 min
Max
239 min

Outages usually last about 20 min.

Some are over quickly (sometimes within 5 min), others take longer (up to 62 min). That varies per outage.

Already longer than 62 min? The attraction may stay closed a while longer.

Outages per day

39 days

0 2 4 6
Min
2
Q1
2
Median
2
Q3
4
Max
5

On days with outages, we see an average of 2 per day.

That usually falls between 2 and 4.

On quiet days it was 2, on busy days up to 5.

Historical

Wait-time build-up

Today compared with historical wait times by hour.

Today Expected Historical
Horizontal axis hours, vertical axis queue minutes. 0 min 5 min 10 min 15 min 20 min 10:00 12:00 14:00 16:00 18:00 20:00 21:00