

← Back to Disneyland Park
Ride details

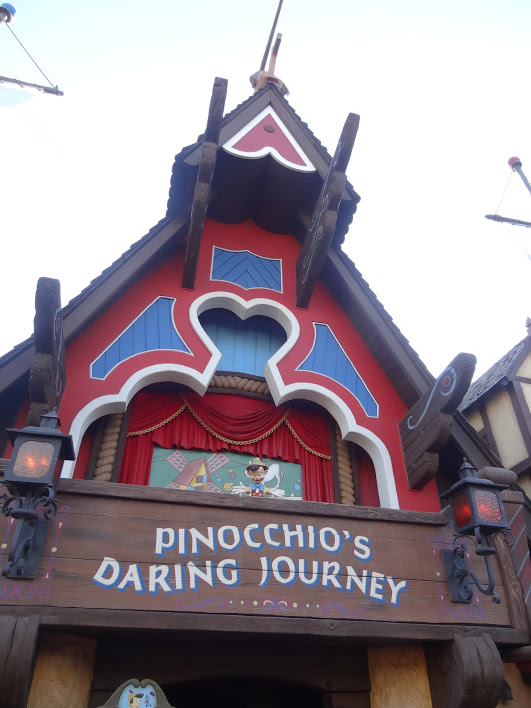
Pinocchio's Daring Journey

Een Fantasyland-darkride zonder minimumlengte door Pinocchio's vlucht langs Stromboli, Pleasure Island en Monstro.

Pinocchio's Daring Journey is een snelle, donkere samenvatting van de film uit 1940. Gasten stappen in een houtsnijderskar, ontsnappen uit Stromboli's poppentheater, belanden op Pleasure Island en komen uiteindelijk oog in oog met Monstro. De rit hoort bij New Fantasyland en gebruikt klassieke darkride-trucs: lichteffecten, figuren, Pepper's Ghost-momenten en precies genoeg dreiging om de wens naar een goed einde voelbaar te maken.

Normal 5 min
Average 8 min
Highest measurement 35 min Measured at 27-07 18:29
Type Ride
Category Dark Ride
Photos
RCDB

Coaster profile

Classification

Scale low
Opened May 25, 1983
Ride type Classic dark ride
Designer Walt Disney Imagineering / WED Enterprises
Vehicle type Woodcarver's carts
Duration 2 minutes
Minimum height None
Area Fantasyland
New Fantasyland attraction 1983
Film source Pinocchio (1940)

Tracks

Ride duration 2:00

Trains

Arrangement Houtsnijderskar-voertuigen rijden door een klassieke Fantasyland-darkride; betrouwbare bronnen geven geen eenduidig voertuig- of vlootaantal, dus harde capaciteitsvelden blijven leeg.

Notes

De officiele Disneyland Resort-pagina vermeldt Fantasyland, Any Height, woodcarver's carts, Stromboli, Pleasure Island, Monstro en de 1940-filmcontext. D23 vermeldt 25 mei 1983 als Disneyland-opening en WED Enterprises-ontwikkeling; sommige secundaire sites noemen 23 mei 1983, daarom is hier de officiele D23-datum aangehouden.

Theming

Fantasyland-darkride naar Pinocchio, met Stromboli Puppet Theatre, Blue Fairy, Jiminy Cricket, Pleasure Island, Lampwick, Coachman, Monstro, Geppetto's workshop en When You Wish Upon a Star-erfenis.

Data

Wait statistics

Based on available measurements and historical wait-time data.

Now Closed
Normal 5 min
Average 8 min
Highest measurement 35 min Measured at 27-07 18:29
Measurements 7258
Outage measurements 293
Avg. outage duration 35 min
Often busy 11:00 10 min average
Often quiet 08:00 5 min average
Reliability High 7863 measurements, 16 hour blocks
Distribution

Boxplots

Spread of wait times, outage duration, and the number of outages per day based on available historical data.

Wait times

7258 measurements

0 min 10 min 20 min 30 min 40 min
Min
0 min
Q1
5 min
Median
5 min
Q3
10 min
Max
35 min

Typical wait time: around 5 min.

It usually falls between 5 min and 10 min.

See more than 10 min? It is probably busier than usual — consider a quieter moment.

Less than 5 min? You are in luck: that does not happen often.

Outage duration

118 outages

0 min 40 min 80 min 120 min 160 min
Min
5 min
Q1
5 min
Median
6 min
Q3
16 min
Max
139 min

Outages usually last about 6 min.

Some are over quickly (sometimes within 5 min), others take longer (up to 16 min). That varies per outage.

Already longer than 16 min? The attraction may stay closed a while longer.

Outages per day

34 days

0 2 4 6 8
Min
1
Q1
2
Median
3
Q3
6
Max
8

On days with outages, we see an average of 3 per day.

That usually falls between 2 and 6.

On quiet days it was 1, on busy days up to 8.

Historical

Wait-time build-up

Today compared with historical wait times by hour.

Today Expected Historical
Horizontal axis hours, vertical axis queue minutes. 0 min 5 min 10 min 15 min 20 min 08:00 11:00 14:00 17:00 20:00 23:00 00:00