

Wait times
Not enough data yet for a boxplot.
There are not enough wait-time measurements yet to spot a pattern.
You can temporarily save favorites in cookies. Create a free account or log in to use them on every device.
Drag parks to set your own order.
You have no favorite parks yet. Tap the star on a park to add one.
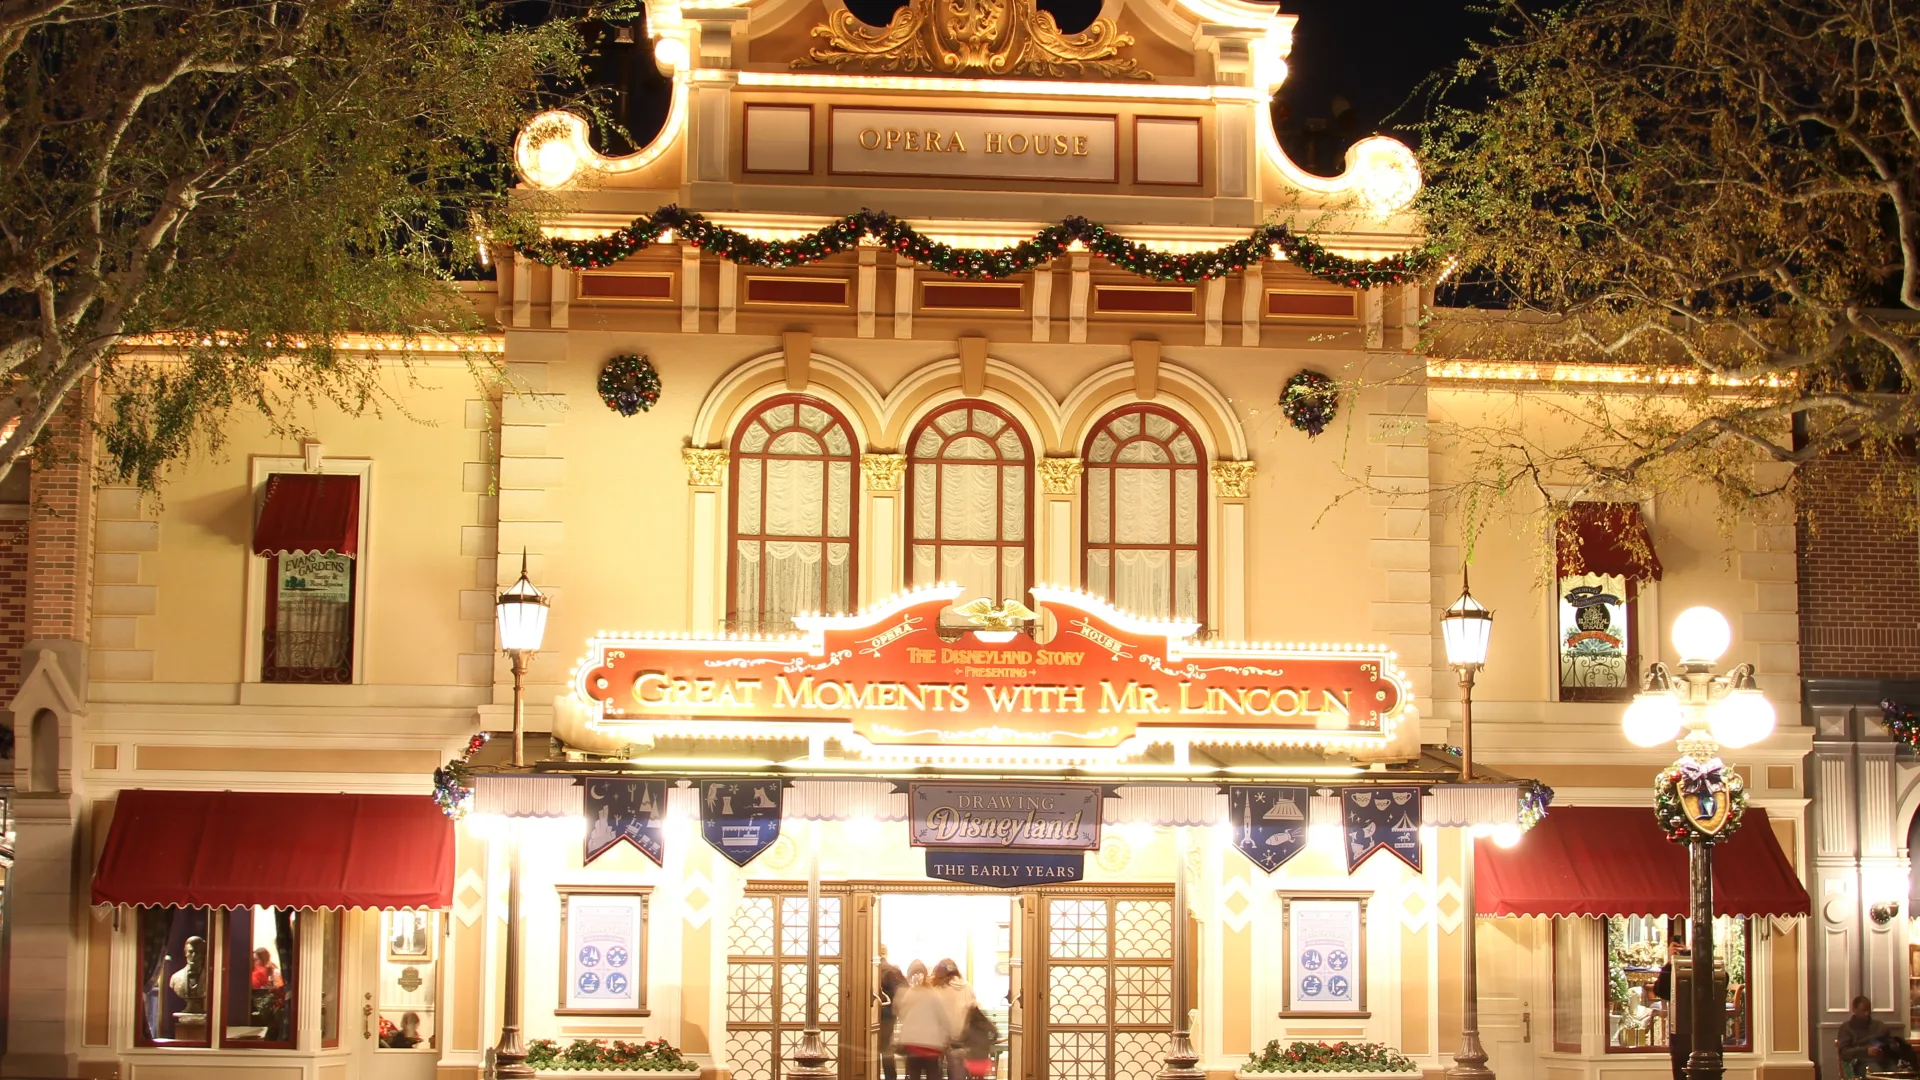
Opera House - Walt Disney - A Magical Life bundelt de Main Street Opera House-galerie met de theaterpresentatie rond Walt Disney.
De Main Street Opera House-versie van Walt Disney - A Magical Life combineert een galerie over Disneyland-historie met een theaterervaring over Walts leven en nalatenschap. Het hoogtepunt is de scène in Walts kantoor, waar Audio-Animatronics-techniek wordt gebruikt voor een eerbetoon aan de man achter Disneyland.
De officiële Main Street Opera House-pagina beschrijft een gallery experience over de ontwikkeling van Disneyland en Walt Disney - A Magical Life als show die na de eerste run rouleert met Great Moments with Mr. Lincoln. Disney Parks Blog bevestigt het debuut op 17 juli 2025.
Main Street Opera House-historie, Disneyland-archiefmateriaal, Walt Disney Imagineering, Walt Disney Archives en Audio-Animatronics-erfgoed.
Based on available measurements and historical wait-time data.
Spread of wait times, outage duration, and the number of outages per day based on available historical data.
Not enough data yet for a boxplot.
There are not enough wait-time measurements yet to spot a pattern.
48 outages
Outages usually last about 6 min.
Some are over quickly (sometimes within 5 min), others take longer (up to 32 min). That varies per outage.
Already longer than 32 min? The attraction may stay closed a while longer.
24 days
On days with outages, we see an average of 2 per day.
That usually falls between 2 and 2.
On quiet days it was 1, on busy days up to 5.
Today compared with historical wait times by hour.