

← Back to Disneyland Park
Ride details

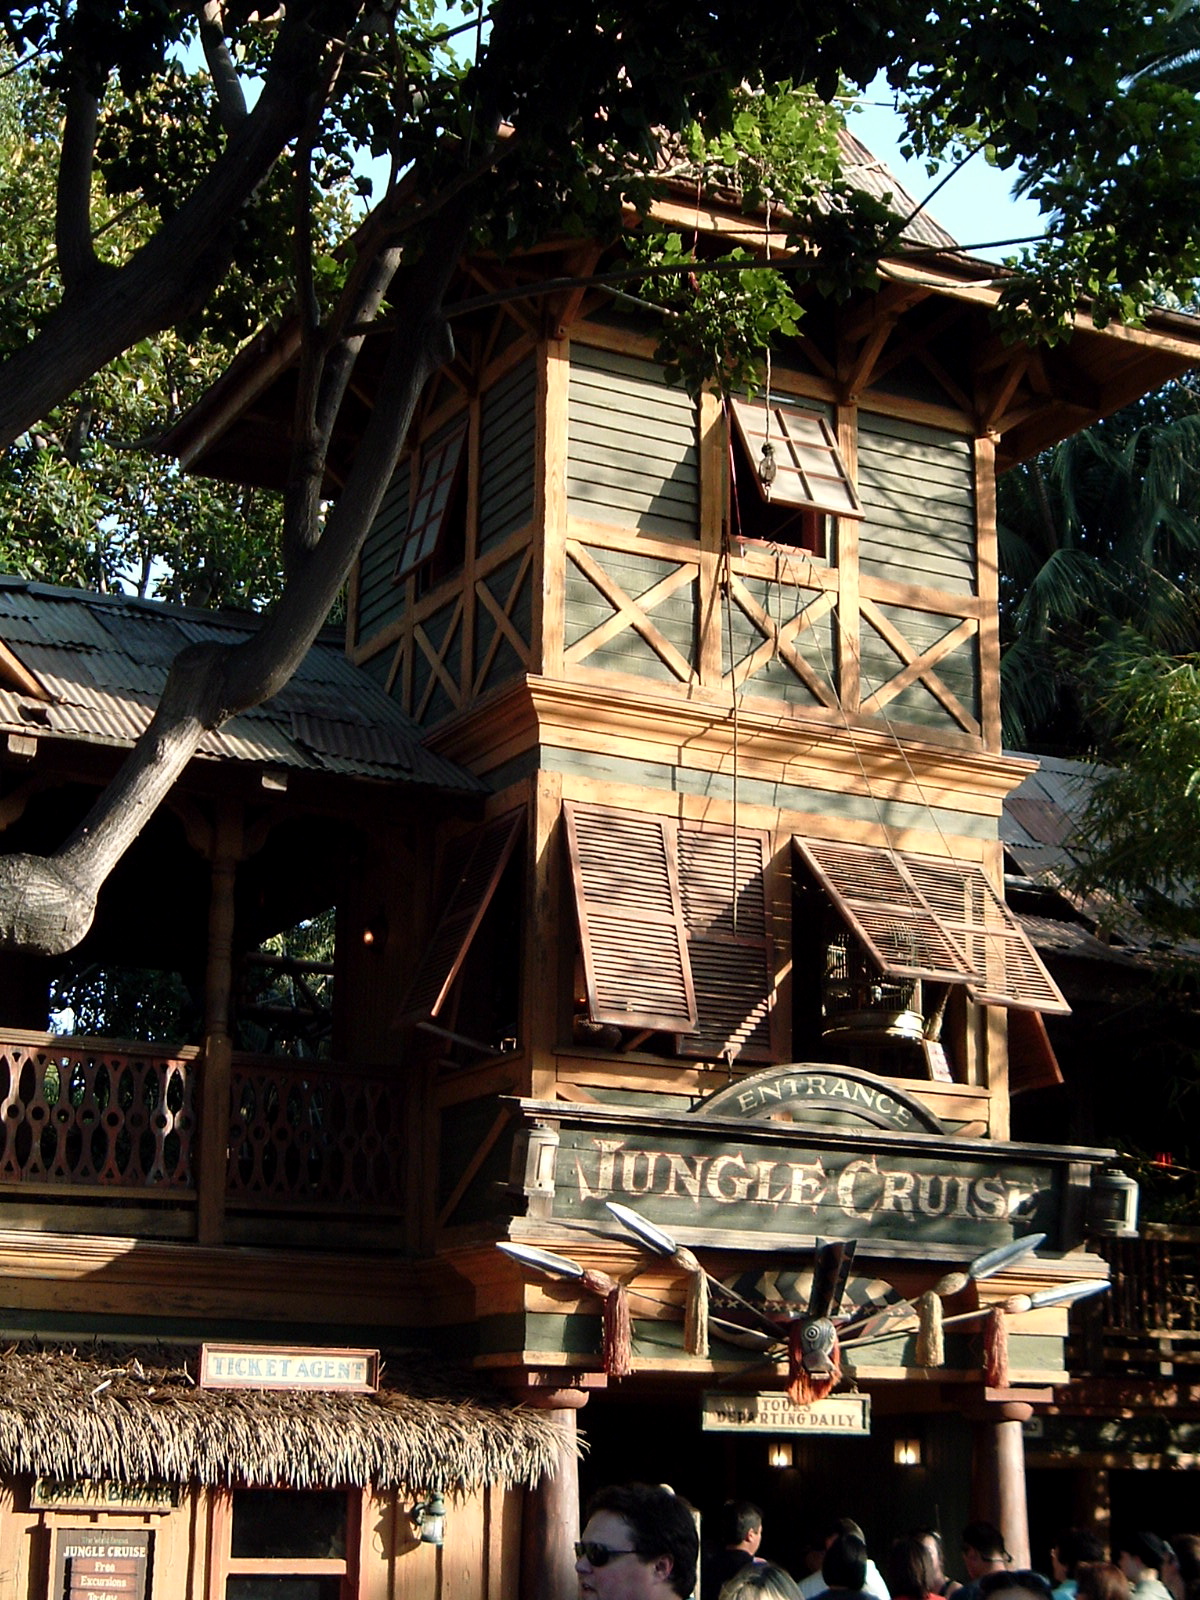
Jungle Cruise

Een opening-day Adventureland-boottocht zonder minimumlengte langs exotische rivieren, dierenfiguren en skippers vol woordgrappen.

Jungle Cruise is Disneyland in avonturenfilmvorm: gasten stappen in een overdekte tramp steamer en varen met een skipper langs tempels, jungleoevers, watervallen en dieren die vaak net iets slimmer lijken dan de mensen aan boord. De rit is sinds 1955 onderdeel van Adventureland en dankt zijn karakter minstens zo veel aan live vertelling en droge humor als aan de showdecors.

Normal 10 min
Average 15 min
Highest measurement 50 min Measured at 19-06 16:30
Type Ride
Category Boat ride
Photos
RCDB

Coaster profile

Classification

Scale low
Opened July 17, 1955
Ride type Guided river boat ride
Designer WED Enterprises / Walt Disney Imagineering
Vehicle type Canopied tramp steamers
Area Adventureland
Minimum height None
Original Disneyland era 1955
Narration Live skipper spiel

Trains

Arrangement Geleide rivierboten met live skipper aan boord; Disneyland Resort omschrijft de voertuigen als canopied tramp steamers, maar exacte vloot- en bootcapaciteit zijn niet als kernvelden gezet.

Notes

De officiele Disneyland Resort-pagina vermeldt Adventureland, Any Height, canopied tramp steamers en een tong-in-de-wang tocht over afgelegen rivieren. D23 vermeldt Jungle Cruise als Adventureland-attractie die op 17 juli 1955 opende en als een van de opening-day attracties van Disneyland.

Theming

Adventureland-rivierexpeditie met canopied tramp steamers, skippers, animatronic wildlife, tempelruines, watervallen, wereldrivieren en klassieke Jungle Cruise-humor.

Data

Wait statistics

Based on available measurements and historical wait-time data.

Now Closed
Normal 10 min
Average 15 min
Highest measurement 50 min Measured at 19-06 16:30
Measurements 8167
Outage measurements 98
Avg. outage duration 14 min
Often busy 10:00 20 min average
Often quiet 08:00 5 min average
Reliability High 8328 measurements, 16 hour blocks
Distribution

Boxplots

Spread of wait times, outage duration, and the number of outages per day based on available historical data.

Wait times

8167 measurements

0 min 15 min 30 min 45 min 60 min
Min
5 min
Q1
10 min
Median
15 min
Q3
20 min
Max
50 min

Typical wait time: around 15 min.

It usually falls between 10 min and 20 min.

See more than 20 min? It is probably busier than usual — consider a quieter moment.

Less than 10 min? You are in luck: that does not happen often.

Outage duration

45 outages

0 min 25 min 50 min 75 min 100 min
Min
5 min
Q1
5 min
Median
6 min
Q3
15 min
Max
88 min

On average, an outage lasts about 6 min.

In three out of four cases, the attraction reopens within 15 min.

If it takes longer, expect extra waiting time.

Outages per day

21 days

0 1 2 3 4
Min
1
Q1
2
Median
2
Q3
2
Max
4

On days with outages, we see an average of 2 per day.

That usually falls between 2 and 2.

On quiet days it was 1, on busy days up to 4.

Historical

Wait-time build-up

Today compared with historical wait times by hour.

Today Expected Historical
Horizontal axis hours, vertical axis queue minutes. 0 min 5 min 10 min 15 min 20 min 08:00 11:00 14:00 17:00 20:00 23:00 00:00