

← Back to Disneyland Park
Ride details

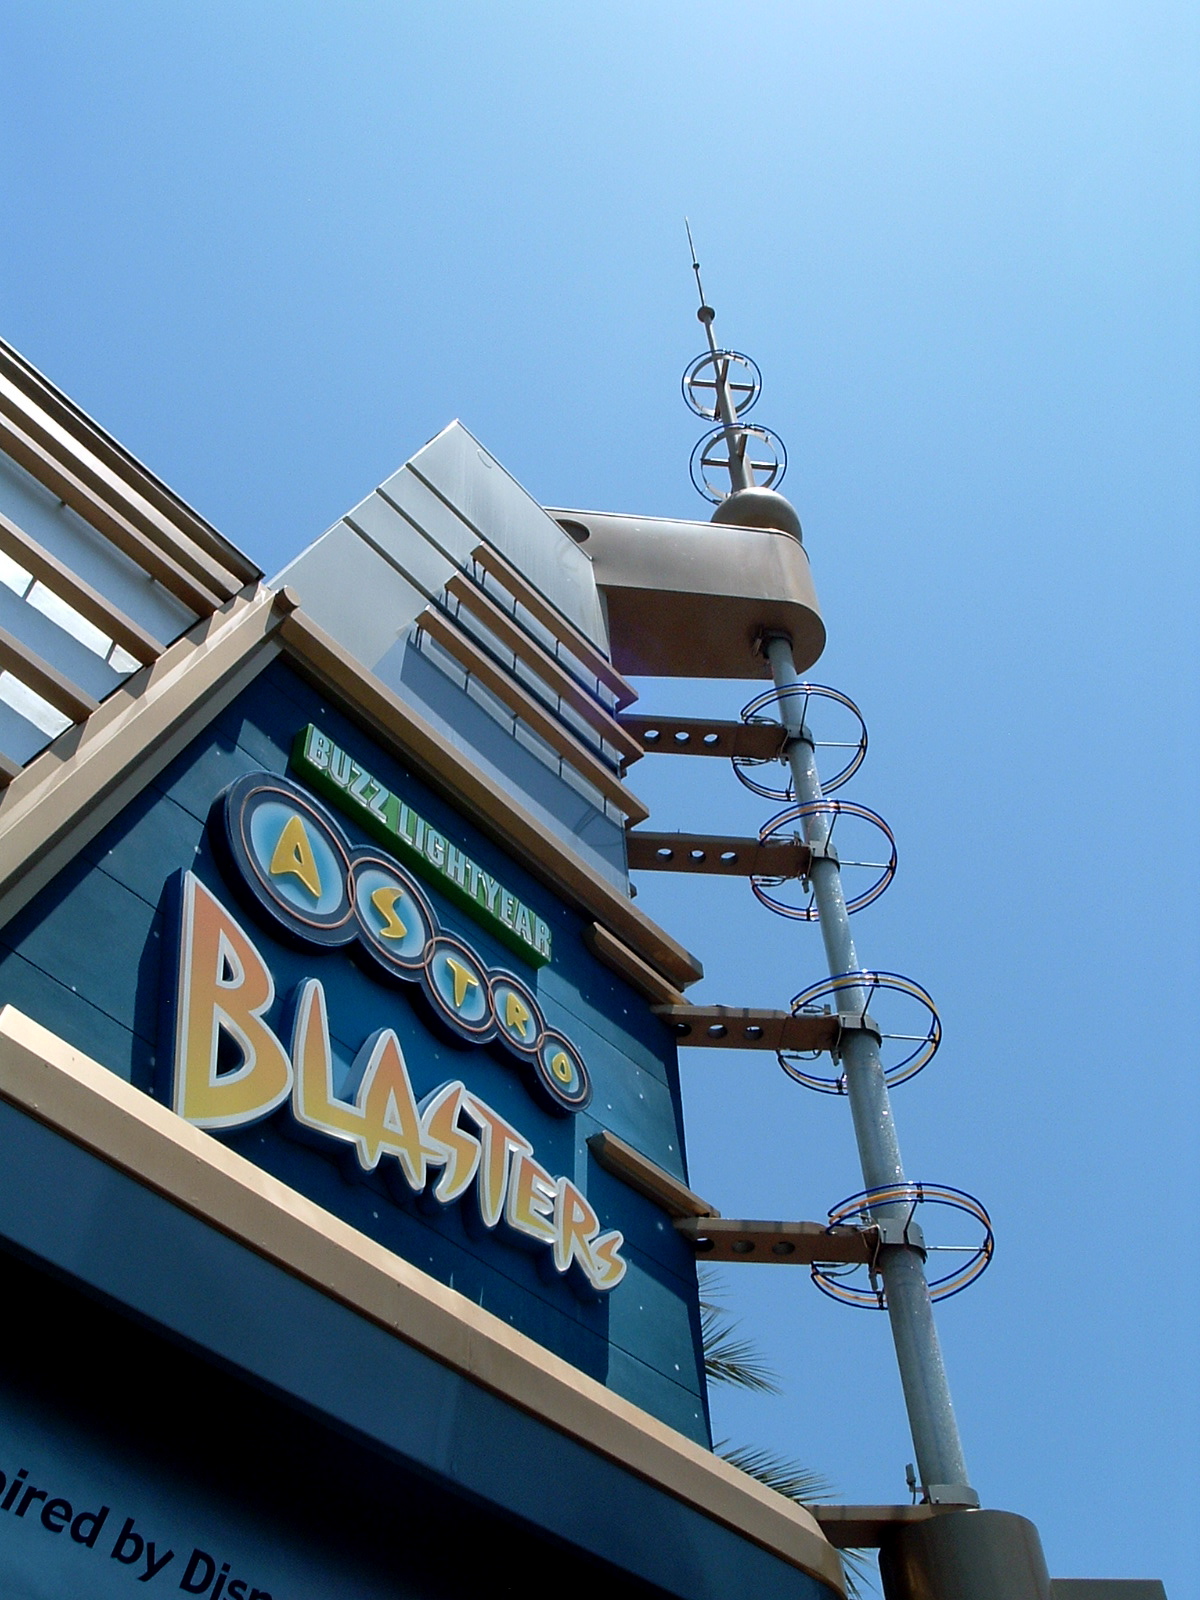
Buzz Lightyear Astro Blasters

Een interactieve Tomorrowland-darkride zonder minimumlengte, waarin Space Rangers met lasers op Zurgs doelen schieten.

Buzz Lightyear Astro Blasters maakt van een donkere Toy Story-missie een scorejacht. Gasten stappen in XP-40 space cruisers, draaien hun voertuig zelf en richten laserkanonnen op verlichte Z-doelen terwijl Zurg energie probeert te stelen. De attractie past goed bij Tomorrowland omdat techniek, competitie en Pixar-humor samen een rit opleveren die rustig beweegt, maar toch actief aanvoelt.

Normal 20 min
Average 17 min
Highest measurement 50 min Measured at 23-07 14:49
Type Ride
Category Dark Ride
Photos
RCDB

Coaster profile

Classification

Scale family
Opened March 17, 2005
Grand opening ceremony 2005-05-05
Ride type Interactive shooter dark ride
Designer Walt Disney Imagineering
Vehicle type XP-40 space cruisers
Control Joystick-controlled 360-degree rotation
Scoring Laser cannons and Z targets
Minimum height None
Area Tomorrowland

Tracks

Ride duration 5:00

Trains

Arrangement Interactieve XP-40 space cruisers met 2 zitplaatsen volgens Dark Ride Database; gasten draaien het voertuig 360 graden met een joystick en gebruiken laserkanonnen om Zurg-doelen te raken.
Riders per train 2
Capacity per hour 1,600

Notes

De officiele Disneyland Resort-pagina vermeldt Tomorrowland, Any Height, XP-40 space cruisers, 360-graden joystickrotatie en laserscore-doelen. D23 vermeldt 17 maart 2005 als publieksopening en 5 mei 2005 als ceremoniële opening tijdens de Happiest Celebration on Earth.

Theming

Toy Story / Buzz Lightyear-thema met Star Command, Evil Emperor Zurg, Gamma Quadrant, XP-40 space cruisers, joystickrotatie, laserkanonnen en puntentelling op verlichte Z-doelen.

Data

Wait statistics

Based on available measurements and historical wait-time data.

Now 10 min
Normal 20 min
Average 17 min
Highest measurement 50 min Measured at 23-07 14:49
Measurements 7919
Outage measurements 321
Avg. outage duration 24 min
Often busy 12:00 25 min average
Often quiet 08:00 5 min average
Reliability High 8015 measurements, 16 hour blocks
Distribution

Boxplots

Spread of wait times, outage duration, and the number of outages per day based on available historical data.

Wait times

7919 measurements

0 min 15 min 30 min 45 min 60 min
Min
5 min
Q1
5 min
Median
15 min
Q3
25 min
Max
50 min

Typical wait time: around 15 min.

It usually falls between 5 min and 25 min.

See more than 25 min? It is probably busier than usual — consider a quieter moment.

Less than 5 min? You are in luck: that does not happen often.

Outage duration

79 outages

0 min 25 min 50 min 75 min 100 min
Min
5 min
Q1
5 min
Median
5 min
Q3
25 min
Max
92 min

Outages usually last about 5 min.

Some are over quickly (sometimes within 5 min), others take longer (up to 25 min). That varies per outage.

Already longer than 25 min? The attraction may stay closed a while longer.

Outages per day

24 days

0 4 8 12 16
Min
1
Q1
2
Median
2
Q3
3
Max
14

On days with outages, we see an average of 2 per day.

That usually falls between 2 and 3.

On quiet days it was 1, on busy days up to 14.

Historical

Wait-time build-up

Today compared with historical wait times by hour.

Today Expected Historical
Horizontal axis hours, vertical axis queue minutes. 0 min 10 min 20 min 30 min 08:00 11:00 14:00 17:00 20:00 23:00 00:00