

← Back to Disney California Adventure Park
Ride details

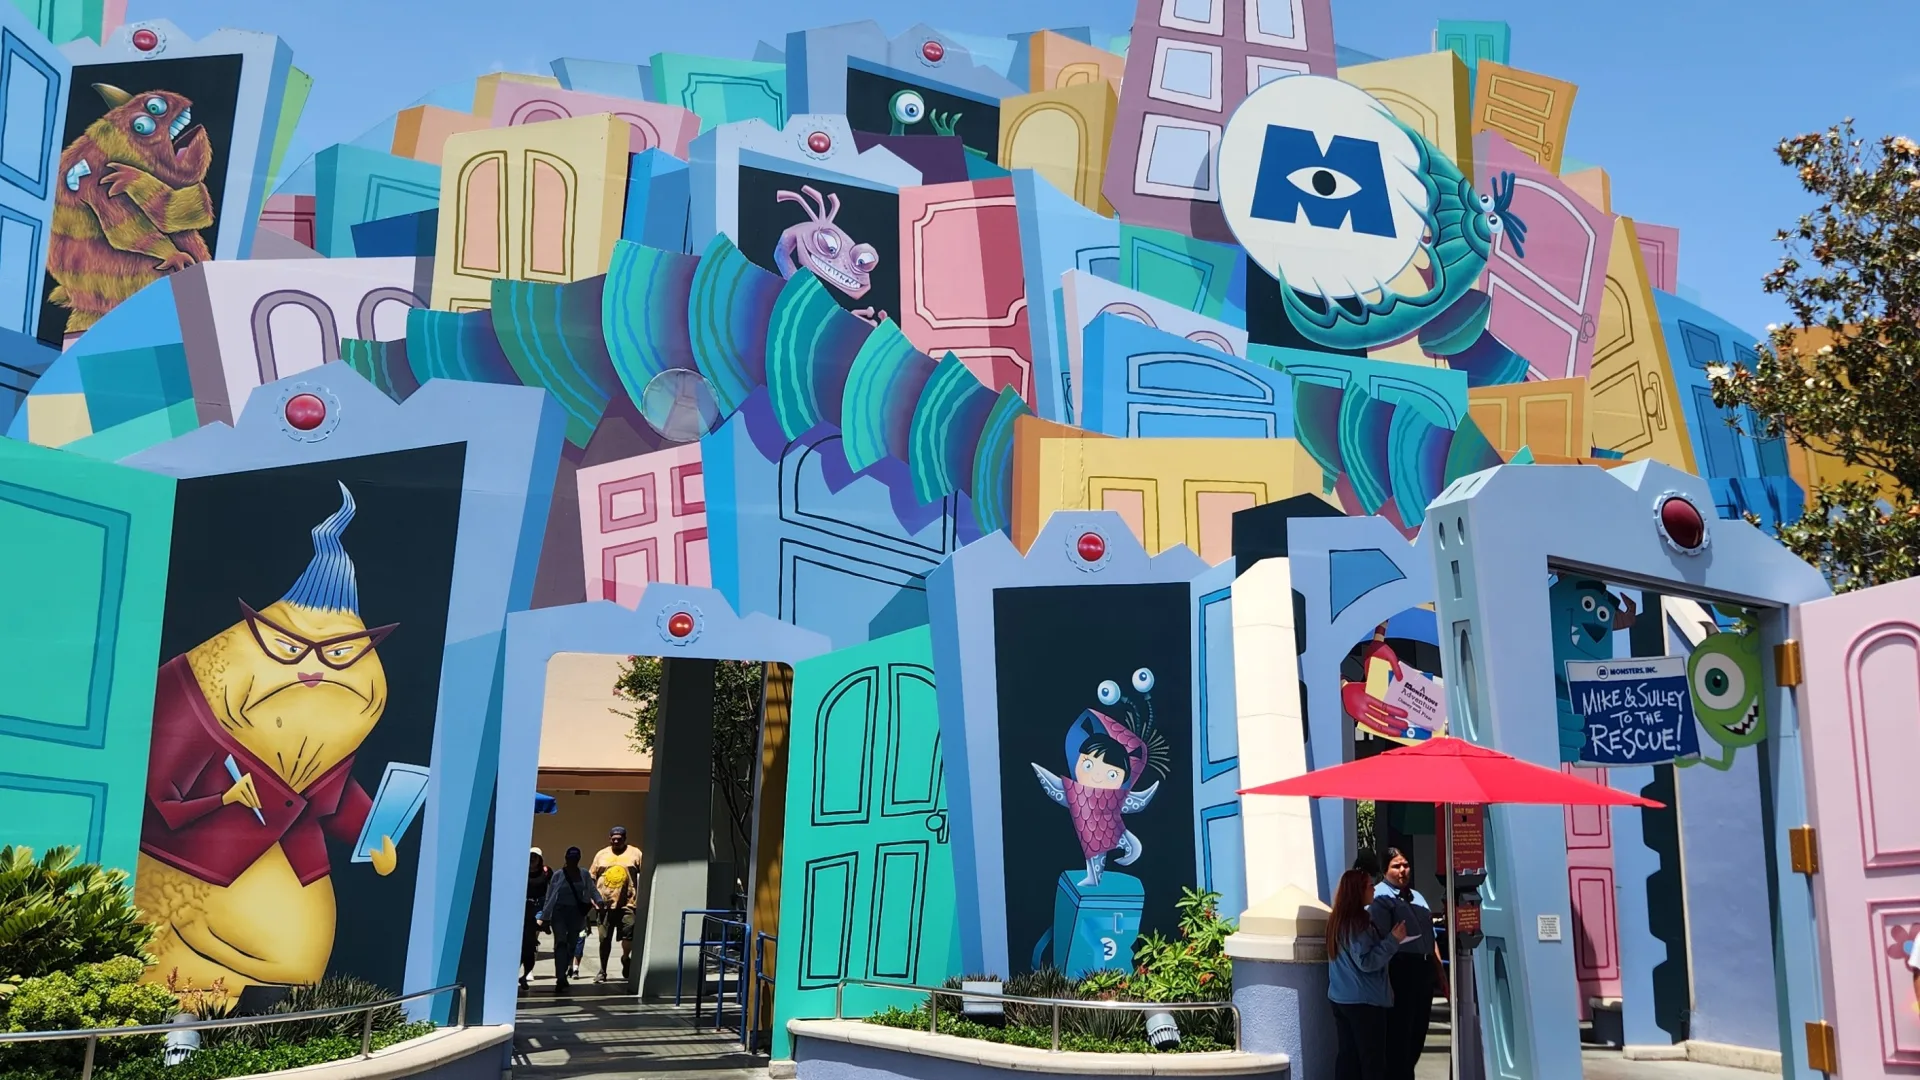
Monsters, Inc. Mike & Sulley to the Rescue!

Een rustige Monsters, Inc.-taxidarkride in Hollywood Land, zonder minimumlengte, waarin Mike en Sulley Boo terug naar huis brengen.

Monsters, Inc. Mike & Sulley to the Rescue! laat bezoekers in Monstropolis-taxi's door de chaos na Boo's ontsnapping rijden. De rit volgt bekende momenten uit de film, met Mike, Sulley, Boo, Randall en Roz, en gebruikt de oude Superstar Limo-infrastructuur voor een zachte indoor darkride.

Normal 30 min
Average 27 min
Highest measurement 65 min Measured at 23-07 15:00
Type Ride
Category Dark Ride
Photos
RCDB

Coaster profile

Classification

Scale low
Grand opening 2006-01-23
Guest previews 2005-12
Ride type Tracked taxi dark ride
Seats per vehicle 6
Duration 4 minutes
Minimum height None
Former attraction Superstar Limo
Planned availability through 2027

Tracks

Ride duration 4:00

Trains

Arrangement Monstropolis-taxivoertuigen op een vaste darkridebaan, hergebruikt van Superstar Limo. Elk voertuig heeft 6 zitplaatsen.
Cars per train 1
Riders per train 6

Notes

De officiële Disneyland Resort-pagina noemt Hollywood Land, Any Height, de Monstropolis Transit Terminal, een taxirit door Monstropolis en de noodmelding dat Boo los is. D23 vermeldt previews in december 2005, de grand opening op 23 januari 2006 en vervanging van Superstar Limo. Dark Ride Database vermeldt Ride and Show Engineering, 6 seats per vehicle/theatre en 4 minuten ritduur; Coasterpedia noemt het een tracked dark ride.

Theming

De rit speelt als een spoedrit door Monstropolis: Boo is los, de CDA zoekt haar, en Mike en Sulley proberen haar via de bekende filmmomenten veilig thuis te krijgen.

Data

Wait statistics

Based on available measurements and historical wait-time data.

Now Closed
Normal 30 min
Average 27 min
Highest measurement 65 min Measured at 23-07 15:00
Measurements 7119
Outage measurements 280
Avg. outage duration 15 min
Often busy 11:00 35 min average
Often quiet 08:00 5 min average
Reliability High 7384 measurements, 14 hour blocks
Distribution

Boxplots

Spread of wait times, outage duration, and the number of outages per day based on available historical data.

Wait times

7119 measurements

0 min 20 min 40 min 60 min 80 min
Min
5 min
Q1
20 min
Median
30 min
Q3
35 min
Max
65 min

Typical wait time: around 30 min.

It usually falls between 20 min and 35 min.

See more than 35 min? It is probably busier than usual — consider a quieter moment.

Less than 20 min? You are in luck: that does not happen often.

Outage duration

119 outages

0 min 20 min 40 min 60 min 80 min
Min
5 min
Q1
5 min
Median
6 min
Q3
21 min
Max
76 min

Outages usually last about 6 min.

Some are over quickly (sometimes within 5 min), others take longer (up to 21 min). That varies per outage.

Already longer than 21 min? The attraction may stay closed a while longer.

Outages per day

35 days

0 3 6 9
Min
1
Q1
2
Median
2
Q3
4
Max
9

On days with outages, we see an average of 2 per day.

That usually falls between 2 and 4.

On quiet days it was 1, on busy days up to 9.

Historical

Wait-time build-up

Today compared with historical wait times by hour.

Today Expected Historical
Horizontal axis hours, vertical axis queue minutes. 0 min 10 min 20 min 30 min 40 min 08:00 10:00 12:00 14:00 16:00 18:00 20:00 22:00