

← Back to Busch Gardens Tampa
Ride details

Tigris

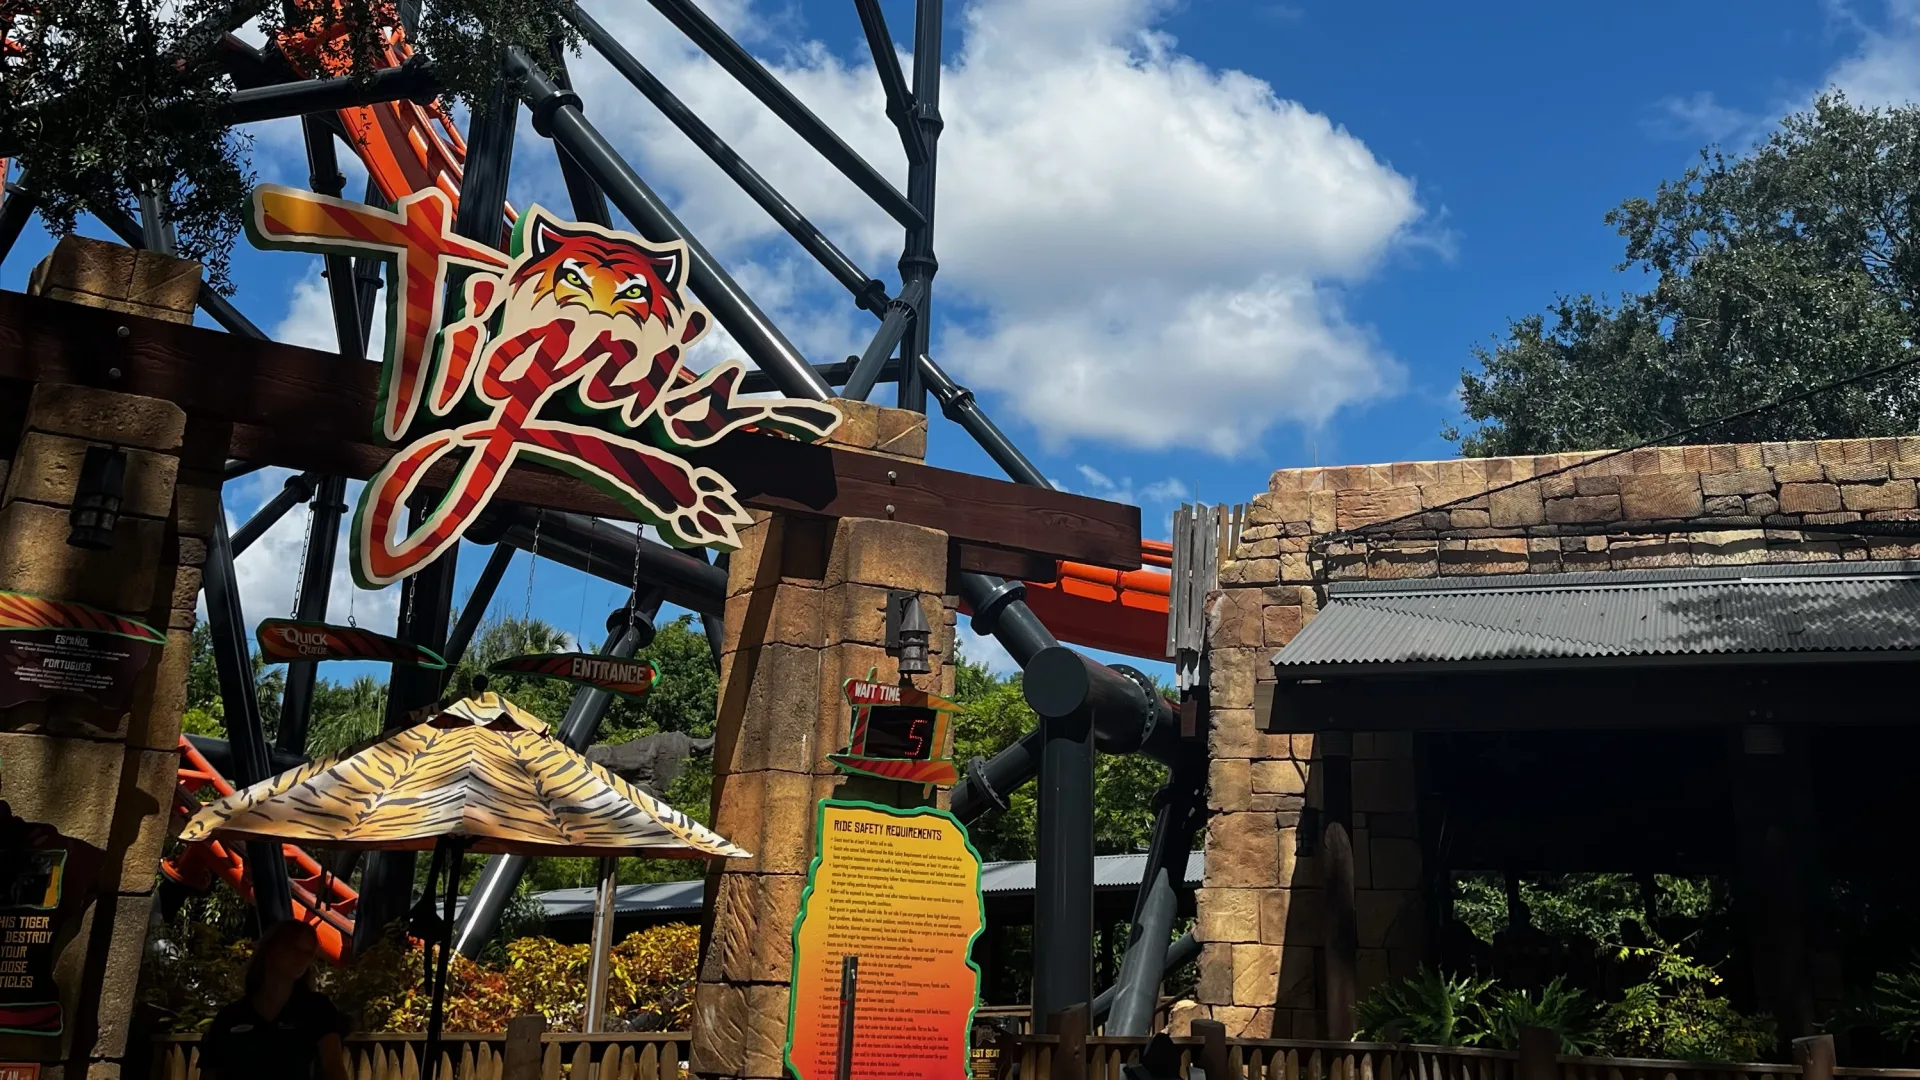
Tigris is a Premier Rides Sky Rocket II that launches riders forward and backward several times.

Tigris is compact but unapologetically intense: the train blasts through the same launch track several times, switches between forward and backward motion, and finishes high above the ground with a vertical climb, heartline roll and non-inverting loop. The tiger theme mainly underlines speed, spring-loaded power and sudden changes of direction.

Normal 5 min
Average 18 min
Highest measurement 85 min Measured at 18-07 16:43
Type Ride
Category Roller coaster
Photos
RCDB

Coaster profile

View on RCDB

Classification

RCDB #16607
RCDB status Operating since April 19, 2019
Classification Roller Coaster
Track type Steel
Design Sit Down
Scale Extreme
Categories Roller Coaster, Steel, Sit Down, Extreme
Steel Fabricator OCEM Structural Steelwork
Official traversed track more than 1.8 ft (0.5 m)
Official minimum height 54 in
Soft opening 2019-04-16

Tracks

Length 863.0 ft (263.0 m)
Height 150.0 ft (45.7 m)
Drop 135.0 ft (41.2 m)
Speed 62.0 mph (99.8 km/h)
Inversions 1

Trains

Arrangement 1 trein met 3 wagens; rijders zitten 2 naast elkaar in 3 rijen, samen 18 rijders.
Trains 1
Cars per train 3
Rows per car 3
Riders per row 2
Riders per train 18

Location

Stanleyville

Notes

Tigris officially opened on April 19, 2019 after soft openings began on April 16, 2019. The coaster stands on the former site of Tanganyika Tidal Wave and reuses part of the existing footprint.

Theming

The tiger theme comes through in the color palette, queue messaging and the emphasis on sudden acceleration. The queue also references tiger conservation and habitat protection.

Data

Wait statistics

Based on available measurements and historical wait-time data.

Now Closed
Normal 5 min
Average 18 min
Highest measurement 85 min Measured at 18-07 16:43
Measurements 1338
Outage measurements 0
Avg. outage duration -
Often busy 14:00 30 min average
Often quiet 10:00 0 min average
Reliability High 1294 measurements, 13 hour blocks
Distribution

Boxplots

Spread of wait times, outage duration, and the number of outages per day based on available historical data.

Wait times

1338 measurements

0 min 25 min 50 min 75 min 100 min
Min
0 min
Q1
5 min
Median
15 min
Q3
30 min
Max
85 min

Typical wait time: around 15 min.

It usually falls between 5 min and 30 min.

See more than 30 min? It is probably busier than usual — consider a quieter moment.

Less than 5 min? You are in luck: that does not happen often.

Outage duration

Not enough data yet for a boxplot.

This attraction has not reported any outages to us yet. We cannot say anything meaningful about it here.

Outages per day

Not enough data yet for a boxplot.

This attraction has not reported any outages to us yet. We cannot say anything meaningful about it here.

Historical

Wait-time build-up

Today compared with historical wait times by hour.

Today Expected Historical
Horizontal axis hours, vertical axis queue minutes. 0 min 10 min 20 min 30 min 10:00 12:00 14:00 16:00 18:00 20:00 21:00