← Back to Busch Gardens Tampa
Ride details

Serengeti Flyer

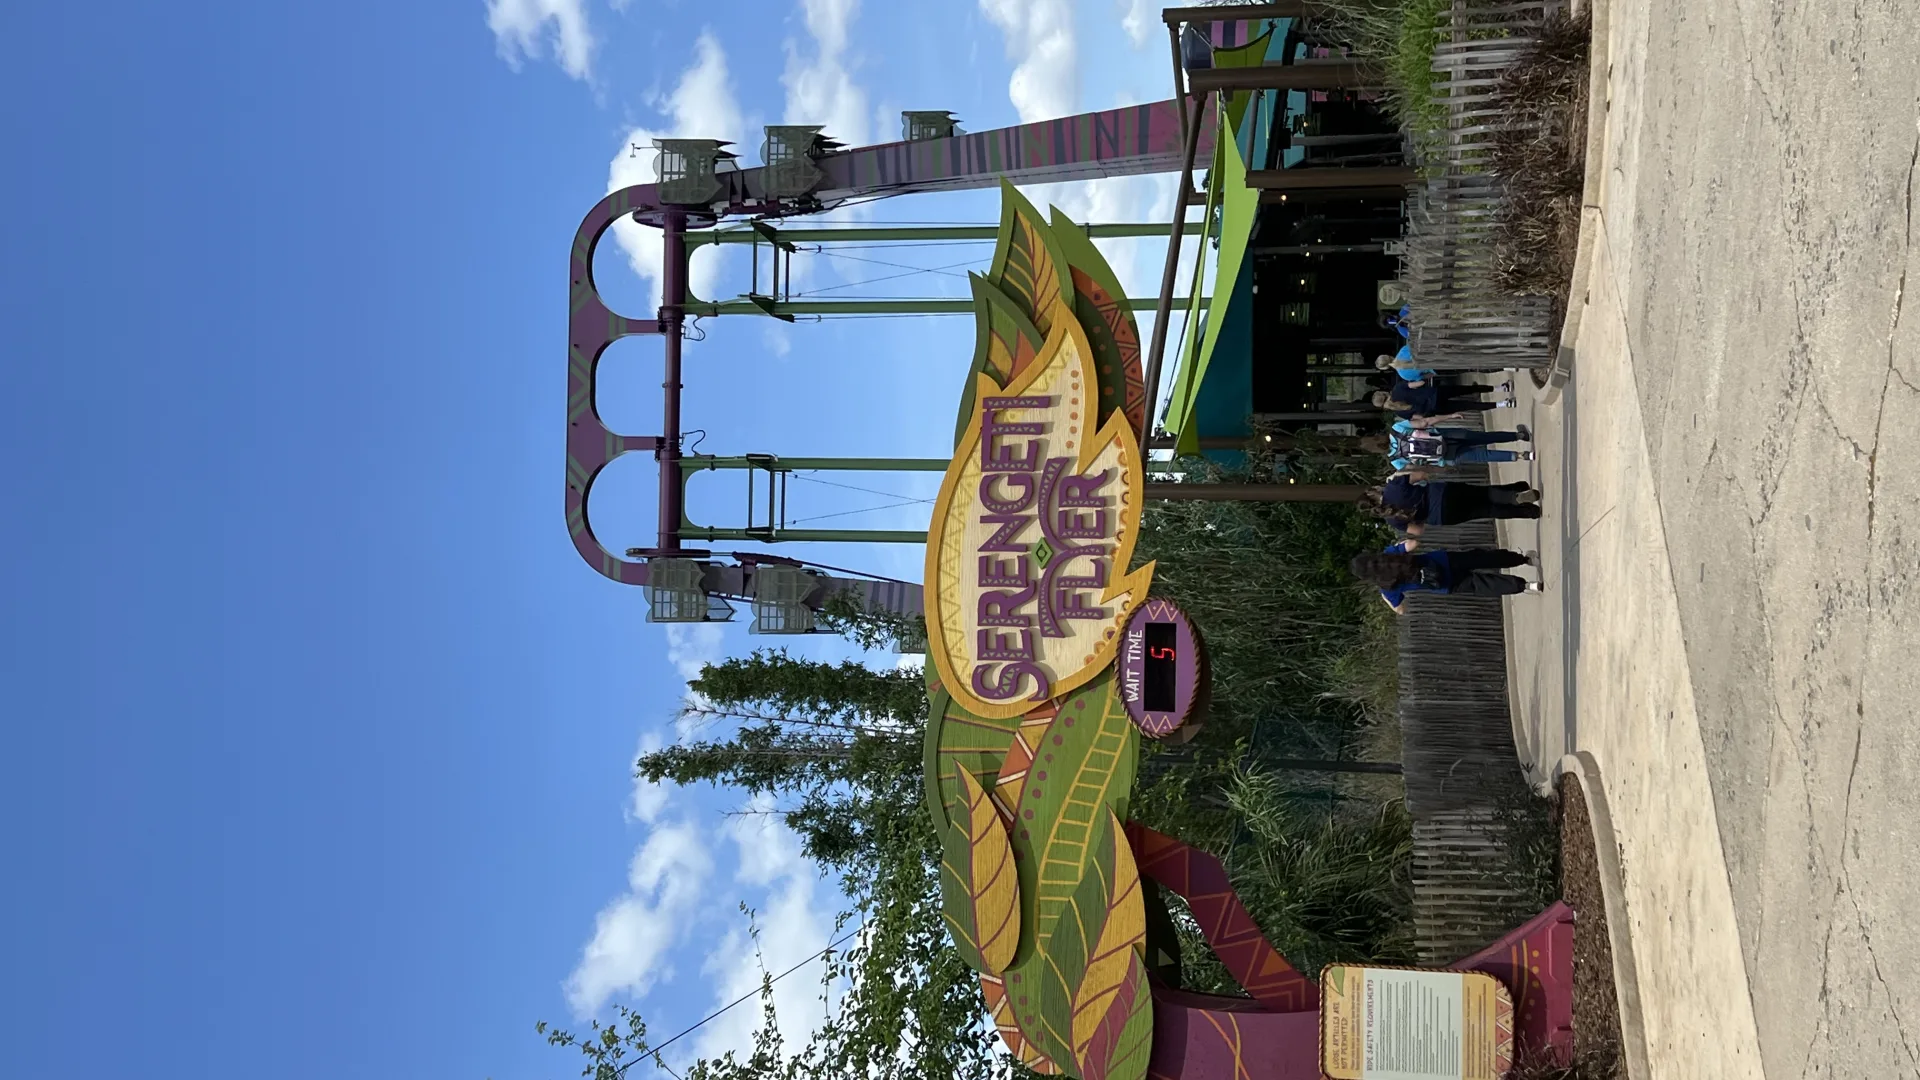
Serengeti Flyer is an S&S Screamin' Swing with two arms soaring over the Serengeti Plain.

Serengeti Flyer uses two opposing arms that swing higher with every pass. The gondolas are mounted back-to-back, so one row feels like it is climbing into the sky while the other dives toward the park. Set above the open Serengeti Plain, the ride stands out with a wide-open and highly visible presence.

Normal 5 min
Average 11 min
Highest measurement 60 min Measured at 31-07 18:44
Type Ride
Category Swing Ride
Photos
RCDB

Coaster profile

Classification

Scale extreme
Official ride height 135.0 ft (41.1 m)
Official speed 68.0 mph (109.4 km/h)
Official seats 40
Coasterpedia structure height 105.0 ft (32.0 m)

Tracks

Height 135.0 ft (41.2 m)
Speed 68.0 mph (109.4 km/h)

Trains

Arrangement Twee gondels met rug-aan-rugzitplaatsen; per zijde zitten 10 rijders naast elkaar, samen 40 rijders per cyclus.
Riders per row 10
Riders per train 40

Notes

Busch Gardens Tampa describes Serengeti Flyer as a dueling S&S Screamin' Swing above the Serengeti Plain, with two arms, a 135-foot peak height, a top speed of 68 mph and 40 riders per cycle. Coasterpedia lists a 105-foot structure height and an opening date of February 27, 2023; the existing profile values retain S&S Worldwide, Screamin' Swing, 135-foot peak height, 68 mph and a 48-inch minimum height.

Theming

The ride sits along the Serengeti Plain and leans heavily on the view, the open space and the sensation of floating above the savanna.


Data

Wait statistics

Based on available measurements and historical wait-time data.

Now Closed
Normal 5 min
Average 11 min
Highest measurement 60 min Measured at 31-07 18:44
Measurements 1329
Outage measurements 0
Avg. outage duration -
Often busy 15:00 15 min average
Often quiet 10:00 0 min average
Reliability High 1283 measurements, 13 hour blocks
Distribution

Boxplots

Spread of wait times, outage duration, and the number of outages per day based on available historical data.

Wait times

1329 measurements

0 min 15 min 30 min 45 min 60 min
Min
0 min
Q1
5 min
Median
5 min
Q3
15 min
Max
60 min

Typical wait time: around 5 min.

It usually falls between 5 min and 15 min.

See more than 15 min? It is probably busier than usual — consider a quieter moment.

Less than 5 min? You are in luck: that does not happen often.

Outage duration

Not enough data yet for a boxplot.

This attraction has not reported any outages to us yet. We cannot say anything meaningful about it here.

Outages per day

Not enough data yet for a boxplot.

This attraction has not reported any outages to us yet. We cannot say anything meaningful about it here.

Historical

Wait-time build-up

Today compared with historical wait times by hour.

Today Expected Historical
Horizontal axis hours, vertical axis queue minutes. 0 min 5 min 10 min 15 min 20 min 10:00 12:00 14:00 16:00 18:00 20:00 21:00