

← Back to Busch Gardens Tampa
Ride details

Kumba

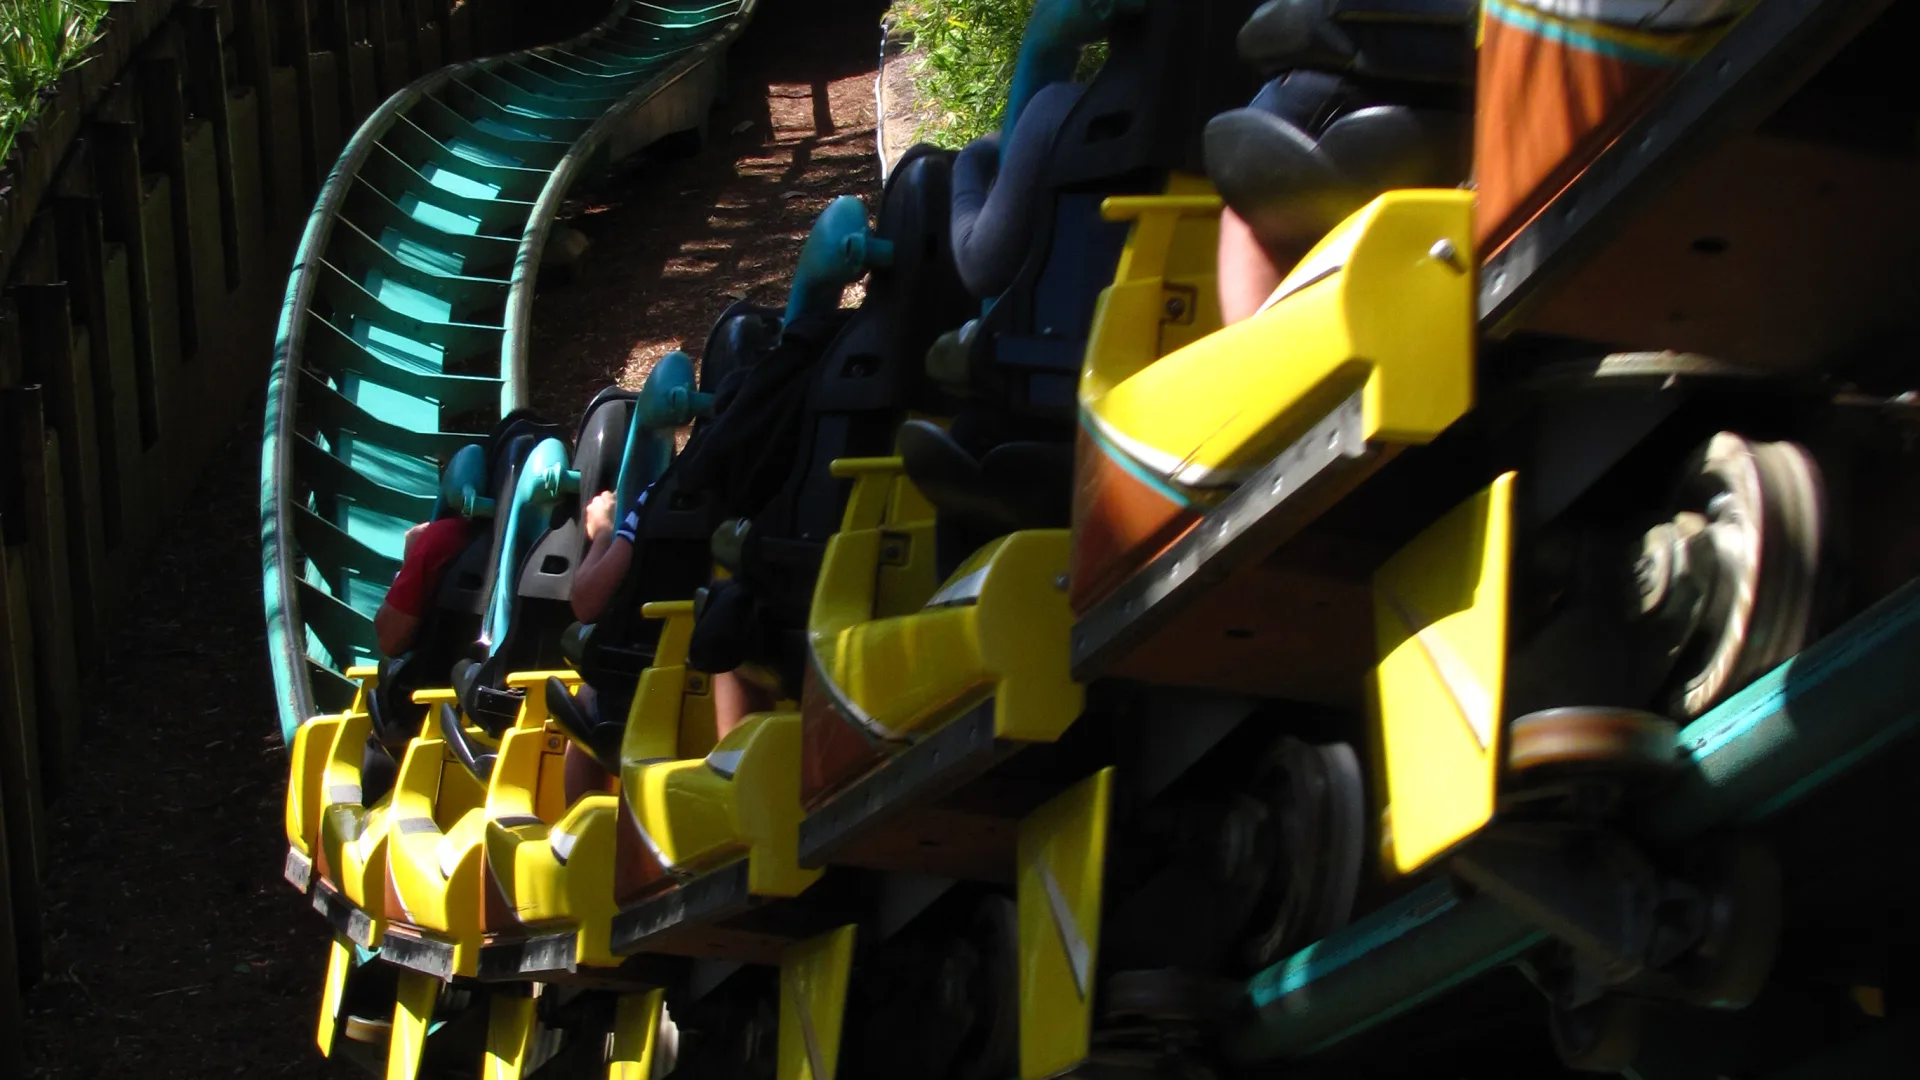
Kumba is the B&M sit-down coaster in Congo, known for seven inversions, a 135-foot drop and a giant loop wrapped around the lift hill.

Kumba is a compact classic packed with element after element: after the first drop, the ride tears through a large vertical loop, then a dive loop, zero-g roll, cobra roll and interlocking corkscrews. The name refers to a roar, which fits perfectly: the train blasts low and loud through the park's Congo section.

Normal 5 min
Average 9 min
Highest measurement 60 min Measured at 26-07 22:46
Type Ride
Category Roller coaster
Photos
RCDB

Coaster profile

View on RCDB

Classification

RCDB #94
RCDB status Operating since April 21, 1993
Classification Roller Coaster
Track type Steel
Design Sit Down
Scale Extreme
Layout Sitting Coaster
Categories Roller Coaster, Steel, Sit Down, Extreme
G-Force 3.8
Technical trains 4 total, 3 simultaneously usable
Opened April 21, 1993

Tracks

Length 3,978.0 ft (1,212.5 m)
Height 143.0 ft (43.6 m)
Drop 134.8 ft (41.1 m)
Speed 60.0 mph (96.6 km/h)
Inversions 7
Ride duration 2:54

Trains

Arrangement 3 treinen met 8 wagens per trein; rijders zitten 4 naast elkaar op 1 rij, samen 32 rijders per trein.
Trains 3
Cars per train 8
Rows per car 1
Riders per row 4
Riders per train 32
Capacity per hour 1,700

Location

Kumba stands in Congo, where it creates one of the most recognizable steel coaster skylines in Busch Gardens Tampa Bay.

Notes

According to RCDB, Kumba means 'roar' in a Congolese language. RCDB also notes that the ride technically has four trains, although no more than three run at the same time.

Theming

The name and presentation play on the idea of a distant roar: in Congo, the coaster is impossible to miss and impossible not to hear.

Name meaning

RCDB explains Kumba as 'roar' in a Congolese language.

Data

Wait statistics

Based on available measurements and historical wait-time data.

Now Closed
Normal 5 min
Average 9 min
Highest measurement 60 min Measured at 26-07 22:46
Measurements 1066
Outage measurements 0
Avg. outage duration -
Often busy 11:00 5 min average
Often quiet 11:00 5 min average
Reliability High 1112 measurements, 11 hour blocks
Distribution

Boxplots

Spread of wait times, outage duration, and the number of outages per day based on available historical data.

Wait times

1066 measurements

0 min 15 min 30 min 45 min 60 min
Min
5 min
Q1
5 min
Median
5 min
Q3
5 min
Max
60 min

Typical wait time: around 5 min.

It usually falls between 5 min and 5 min.

See more than 5 min? It is probably busier than usual — consider a quieter moment.

Less than 5 min? You are in luck: that does not happen often.

Outage duration

Not enough data yet for a boxplot.

This attraction has not reported any outages to us yet. We cannot say anything meaningful about it here.

Outages per day

Not enough data yet for a boxplot.

This attraction has not reported any outages to us yet. We cannot say anything meaningful about it here.

Historical

Wait-time build-up

Today compared with historical wait times by hour.

Today Expected Historical
Horizontal axis hours, vertical axis queue minutes. 0 min 5 min 10 min 15 min 20 min 10:00 12:00 14:00 16:00 18:00 20:00 21:00