

← Back to Bobbejaanland
Ride details

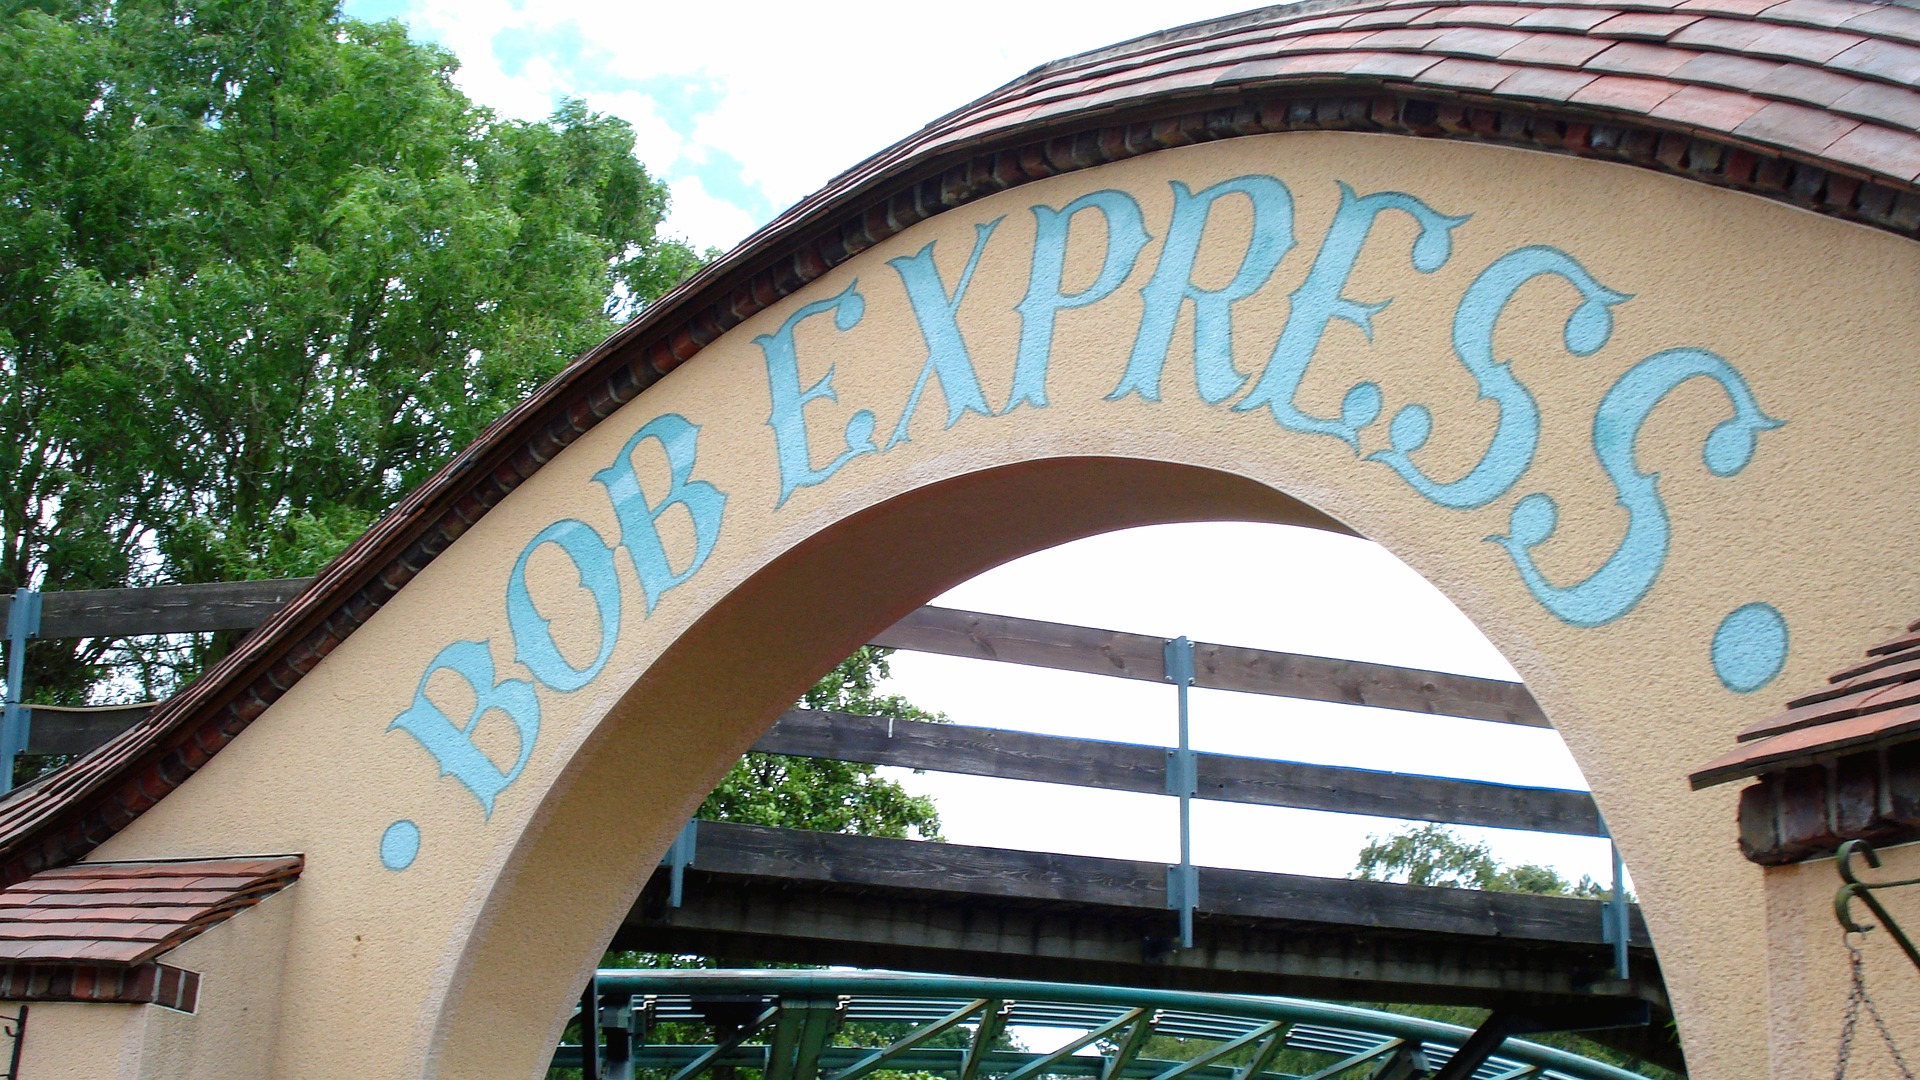
Bob Express

Mack Rides powered coaster that races like a runaway train through Mystery Bay and along the water.

Bob Express feels like a family train that is in slightly too much of a hurry: the powered drive keeps the pace up as the train threads through the rocky scenery and past the station. It is technically a coaster, but at 22 mph it stays broadly accessible.

Normal 5 min
Average 12 min
Highest measurement 51 min Measured at 29-06 11:17
Type Ride
Category Roller coaster
Photos
RCDB

Coaster profile

View on RCDB

Classification

RCDB #919
RCDB status Operating since May 15, 2000
Classification Powered Coaster
Track type Steel
Design Sit Down
Scale Family
Categories Powered Coaster, Steel, Sit Down, Family
Opening 15-05-2000
Capaciteit 1.520 personen per uur
Installateur Barth Schaustellerbetriebe
Kosten 3.350.000
Officieel gebied Mystery Bay

Tracks

Length 1,709.3 ft (521.0 m)
Height 32.8 ft (10.0 m)
Speed 22.4 mph (36.0 km/h)
Inversions 0
Ride duration 2:30

Trains

Arrangement 1 trein met 10 wagens; Coasterpedia specificeert 38 rijders per trein met een afwijkende voorste motorwagen en overige tweerijige wagens.
Trains 1
Cars per train 10
Riders per train 38
Capacity per hour 1,520

Location

Bob Express sits in Mystery Bay, with water and rockwork right alongside the layout.

Notes

RCDB lists Bob Express as a Mack powered coaster with 1,709 ft of track, 33 ft of height, 22 mph, a 15 May 2000 opening date, one train with 10 cars and 1,520 pph. The official Bobbejaanland page mentions a route of about 1,706 ft and adult supervision for riders between 3 ft 11 in and 4 ft 7 in. Coasterpedia adds a 38-rider train layout and mentions helix and hill elements.

Theming

The ride uses a train setting with a Mexican touch in Mystery Bay, while water and rockwork do most of the scene-setting.

Data

Wait statistics

Based on available measurements and historical wait-time data.

Now Closed
Normal 5 min
Average 12 min
Highest measurement 51 min Measured at 29-06 11:17
Measurements 1526
Outage measurements 108
Avg. outage duration 134 min
Often busy 11:00 20 min average
Often quiet 10:00 5 min average
Reliability High 1606 measurements, 11 hour blocks
Distribution

Boxplots

Spread of wait times, outage duration, and the number of outages per day based on available historical data.

Wait times

1526 measurements

0 min 15 min 30 min 45 min 60 min
Min
0 min
Q1
5 min
Median
6 min
Q3
15 min
Max
51 min

Typical wait time: around 6 min.

It usually falls between 5 min and 15 min.

See more than 15 min? It is probably busier than usual — consider a quieter moment.

Less than 5 min? You are in luck: that does not happen often.

Outage duration

44 outages

0 min 20 min 40 min 60 min 80 min
Min
2 min
Q1
5 min
Median
5 min
Q3
13 min
Max
65 min

On average, an outage lasts about 5 min.

In three out of four cases, the attraction reopens within 13 min.

If it takes longer, expect extra waiting time.

Outages per day

24 days

0 2 4 6
Min
1
Q1
1
Median
2
Q3
3
Max
5

On days with outages, we see an average of 2 per day.

That usually falls between 1 and 3.

On quiet days it was 1, on busy days up to 5.

Historical

Wait-time build-up

Today compared with historical wait times by hour.

Today Expected Historical
Horizontal axis hours, vertical axis queue minutes. 0 min 5 min 10 min 15 min 20 min 10:00 12:00 14:00 16:00 18:00 20:00 21:00